Python Programming: Generating A Simple Rock, Paper, Scissors Table Plot
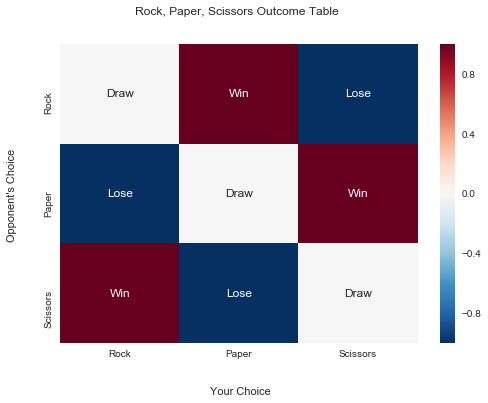
Hi there. In this programming post, I show how to generate a simple rock, paper, scissors table plot in Python. I have enjoyed doing this as the plot came out nice and clean.
The original page is from here.

A Basic Rock, Paper, Scissors Table Plot
To start off, import the pandas, seaborn, numpy and matplotlib's pyplot modules into Python.
### Seaborn Approach - Basic Rock, Paper, Scissors
# https://stackoverflow.com/questions/33158075/custom-annotation-seaborn-heatmap
# https://stackoverflow.com/questions/40734343/artificial-tick-labels-for-seaborn-heatmaps

import pandas as pd
import seaborn as sns
import numpy as np
from matplotlib import pyplot as plt
Next, I create a list of outcome options, a two dimensional Numpy array of numbers and a two dimensional Numpy array of outcome labels. In the second list, a one represents a win, a zero is a draw and a negative one is a loss.
options = ["Rock", "Paper", "Scissors"]

num_outcomes = np.array([[0, 1, -1],
                    [-1, 0, 1],
                    [1, -1, 0]])

labels = np.array([["Draw", "Win", "Lose"],
                    ["Lose", "Draw", "Win"],
                    ["Win", "Lose", "Draw"]])
To start the plotting part, use fig, ax = plt.subplots(). Seaborn's heatmap function is attached to the variable ax. To enable the labels in the heatmap, use the arguments annot = , xticklabels = and yticklabels = .
Plot labels can be added in with set_xlabel, set_ylabel and plt.title.
fig, ax = plt.subplots()

ax = sns.heatmap(num_outcomes, annot = labels, fmt = '',
                 xticklabels = options, yticklabels = options)

ax.set_xlabel("\n\n Your Choice")
ax.set_ylabel("Opponent's Choice \n\n")
plt.title("Rock, Paper, Scissors Outcome Table \n\n")
plt.show(fig)

The generated plot looks nice and it quite easy to follow.

In many countries, there are advanced versions of this game with additional figures.
We played this game with "well" (loses paper, wins other figures).
Also, "Big Bang Theory" shows balanced version with "Lizzard" and "Spock".
![rpsls[1].jpg](https://steemitimages.com/640x0/https://ipfs.busy.org/ipfs/QmYbZ1S4jaVb4Zh4YqCvDzShaD3cLYfYEebvRXsjH5MWNH)
It would be interesting to see plots with fantasy figures :)
I do plan a follow up of this post. A Rock, Paper, Scissors, Lizard, Spock table plot. I've done it in R a while back but not in Python.