Python Programming - A Rock, Paper, Scissors, Lizard, Spock Table Plot
Hi there. This is a follow up to my previous post on creating a rock, paper, scissors plot in Python. The lizard and spock options are included as seen from the Big Bang Theory show.
The original page can be found here.
Setting Up The Table Plot
To start, import the pandas, seaborn, numpy and matplotlib's pyplot modules into Python.
### Seaborn Approach:
# https://stackoverflow.com/questions/33158075/custom-annotation-seaborn-heatmap
# https://stackoverflow.com/questions/40734343/artificial-tick-labels-for-seaborn-heatmaps

import pandas as pd
import seaborn as sns
import numpy as np
from matplotlib import pyplot as plt
The first Python list of three is a list of options. There are five options that the player can choose. These five are:
- Rock
- Paper
- Scissors
- Lizard
- Spock
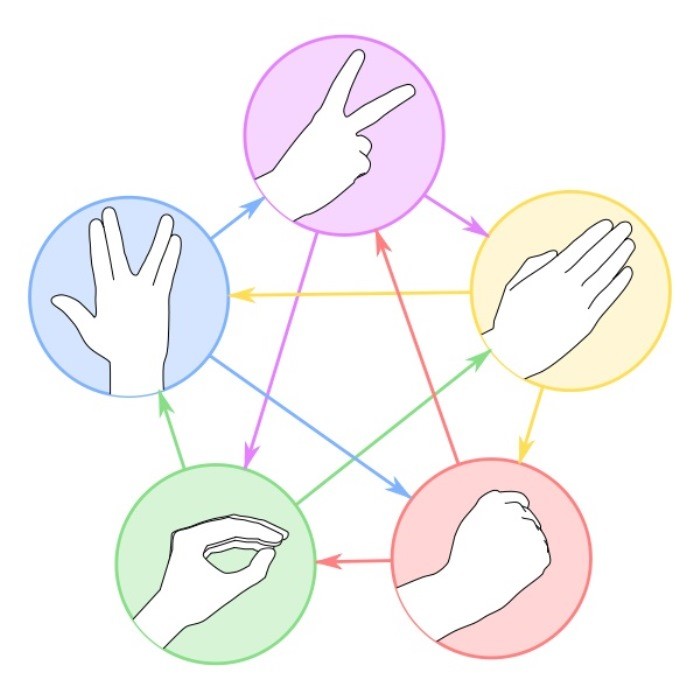
The large image below shows which option beats what.

options = ["Rock", "Paper", "Scissors", "Lizard", "Spock"]
A win for the payer is a 1, a draw is a 0 and a loss for the player is a -1. This two-dimensional Numpy array is for different colours in the upcoming heatmap. A second two-dimensional Numpy array is for the labels which would be easy of the viewer to read.
num_array = np.array([[0, 1, -1, -1, 1],
                    [-1, 0, 1, 1, -1],
                    [1, -1, 0, -1, 1],
                    [1, -1, 1, 0, -1],
                    [-1, 1, -1, 1, 0]])

outcomes_array = np.array([["Draw", "Win", "Lose", "Lose", "Win"],
                    ["Lose", "Draw", "Win", "Win", "Lose"],
                    ["Win", "Lose", "Draw", "Lose", "Win"],
                    ["Win", "Lose", "Win", "Draw", "Lose"],
                    ["Lose", "Win", "Lose", "Win", "Draw"]])
Plotting The Outcome Table
The main part for generating the table plot is Seaborn's heatmap() function. To enable the labels, use annot =, xticklabels = and yticklabels = . Labels and a title is added.
fig, ax = plt.subplots()
ax = sns.heatmap(num_array, annot = outcomes_array, fmt = '',
                 xticklabels = options, yticklabels = options)

ax.set_xlabel("\n\n Your Choice")
ax.set_ylabel("Opponent's Choice \n\n")
plt.title("Rock, Paper, Scissors, Lizard, Spock Outcome Table \n\n")
plt.show(fig)
Beautiful!