A Rock, Paper, Scissors, Lizard, Spock Chart In R
Hi there. In this post, I will show you how to make a rock, paper, scissors, lizard, spock chart in R. The original page can be found at my website here. This post will be formatted here differently than in the original page (This post is shorter.).
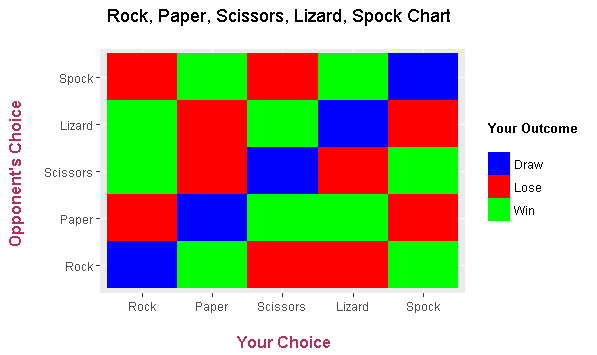
After reading this page, you will be able to create a matrix plot such as this.
An Extension Of Rock, Paper, Scissors
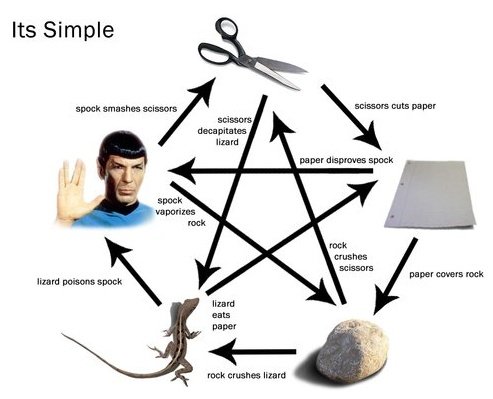
Many people know how to play rock, paper, scissors. In this game, two opponents have to choose one of the options at the same time. With the addition of the lizard and the spock, the rules are pretty much the same but there are more choices and determining the winner is more complex.
Here are a few images showing which choice beats what.

Rock, Paper,
Scissors, Lizard, Spock Chart

Rock, Paper,
Scissors, Lizard, Spock Chart #2
In R, a table version of the above images will be created. This table will be used in helping with creating a colourful matrix plot in R with ggplot2 (shown earlier).
Preliminary Concepts
Before we start with R and coding. I want to explain a few concepts.
The ggplot2 package in R will be used. To install the ggplot2 package in R, type in install.packages("ggplot2") into the R/RStudio console.
After installation, the ggplot2 package can be loaded into R with the line library(ggplot2).
Caretsian Products
In the R code below, I make use of Cartesian products from the mathematical field of Set Theory. Given two separate lists with elements in each, the Cartesian product is a list which contains all possible combinations with the two lists. It is the set of all ordered pairs (a,b) such that
As an example, suppose we have A = {x, y, z} and B = {7, 8}. The Cartesian product of sets A and B would be denoted by A x B. This A x B list would contain 3 x 2 = 6 elements and would be:
The first co-ordinate would be either x, y or z and the second co-ordinate in the ordered pair would be 7 or 8.
The R function which computes Cartesian products is expand.grid().
R Code
The first couple of lines of code involve loading ggplot2 and setting up the table. A Caretsian product in the form of the expand.grid() function is used for creating the table.
library(ggplot2)

choices <- c("Rock", "Paper", "Scissors", "Lizard", "Spock")

dataTable <- expand.grid(choices, choices) # Caretesian product

dataTable <- as.data.frame(dataTable)

dataTable

##        Var1     Var2
## 1      Rock     Rock
## 2     Paper     Rock
## 3  Scissors     Rock
## 4    Lizard     Rock
## 5     Spock     Rock
## 6      Rock    Paper
## 7     Paper    Paper
## 8  Scissors    Paper
## 9    Lizard    Paper
## 10    Spock    Paper
## 11     Rock Scissors
## 12    Paper Scissors
## 13 Scissors Scissors
## 14   Lizard Scissors
## 15    Spock Scissors
## 16     Rock   Lizard
## 17    Paper   Lizard
## 18 Scissors   Lizard
## 19   Lizard   Lizard
## 20    Spock   Lizard
## 21     Rock    Spock
## 22    Paper    Spock
## 23 Scissors    Spock
## 24   Lizard    Spock
## 25    Spock    Spock
The two column names are Var1 and Var2. These column names can be changed with the colnames() function. To complete the table, a third column will be added on. I first create an empty third column with NA. Then I replace these NA values with the appropriate outcome values. The value is either "Win", "Lose" or "Draw" for the player.
# Add third column:

dataTable[ , 3] <- NA

# Add column names:

colnames(dataTable) <- c("You", "Opponent", "Outcome")

# Input third column (outcome) data accordingly:

dataTable[, 3] <- c("Draw", "Win", "Lose", "Lose", "Win",
                    "Lose", "Draw", "Win", "Win", "Lose",
                    "Win", "Lose", "Draw", "Lose", "Win",
                    "Win", "Lose", "Win", "Draw", "Lose",
                    "Lose", "Win", "Lose", "Win", "Draw")

# Place outcome_col as third column and convert as factors:

dataTable[, 3] <- as.factor(dataTable[, 3])

# Check structure:

str(dataTable)

## 'data.frame':    25 obs. of  3 variables:
##  $ You     : Factor w/ 5 levels "Rock","Paper",..: 1 2 3 4 5 1 2 3 4 5 ...
##  $ Opponent: Factor w/ 5 levels "Rock","Paper",..: 1 1 1 1 1 2 2 2 2 2 ...
##  $ Outcome : Factor w/ 3 levels "Draw","Lose",..: 1 3 2 2 3 2 1 3 3 2 ...
##  - attr(*, "out.attrs")=List of 2
##   ..$ dim     : int  5 5
##   ..$ dimnames:List of 2
##   .. ..$ Var1: chr  "Var1=Rock" "Var1=Paper" "Var1=Scissors" "Var1=Lizard" ...
##   .. ..$ Var2: chr  "Var2=Rock" "Var2=Paper" "Var2=Scissors" "Var2=Lizard" ...

# Check #2:

dataTable

##         You Opponent Outcome
## 1      Rock     Rock    Draw
## 2     Paper     Rock     Win
## 3  Scissors     Rock    Lose
## 4    Lizard     Rock    Lose
## 5     Spock     Rock     Win
## 6      Rock    Paper    Lose
## 7     Paper    Paper    Draw
## 8  Scissors    Paper     Win
## 9    Lizard    Paper     Win
## 10    Spock    Paper    Lose
## 11     Rock Scissors     Win
## 12    Paper Scissors    Lose
## 13 Scissors Scissors    Draw
## 14   Lizard Scissors    Lose
## 15    Spock Scissors     Win
## 16     Rock   Lizard     Win
## 17    Paper   Lizard    Lose
## 18 Scissors   Lizard     Win
## 19   Lizard   Lizard    Draw
## 20    Spock   Lizard    Lose
## 21     Rock    Spock    Lose
## 22    Paper    Spock     Win
## 23 Scissors    Spock    Lose
## 24   Lizard    Spock     Win
## 25    Spock    Spock    Draw
The table is now ready for plotting in ggplot2. In ggplot(), I have my choice in the horizontal axis and the opponent's choices on the vertical axis. The fill colours are determined by the outcome for the player. To achieve the tiles, the geom_tile() function is needed.
Functions after geom_tile() is for labels, colours, the title and adjustments. A legend is provided for easy reading for the viewer. To center the title, I use plot.title = element_text(hjust = 0.5)
# Creating the Rock, Paper, Scissors Matrix Plot:

ggplot(dataTable,aes(x = You,y = Opponent, fill = Outcome)) +
  geom_tile() +
  scale_fill_manual(values = c('blue','red', "green")) +
  labs(x = "\n Your Choice", y = "Opponent's Choice \n",
       title = "Rock, Paper, Scissors, Lizard, Spock Chart \n",
       fill = "Your Outcome \n ") +
  theme(plot.title = element_text(hjust = 0.5),
        axis.title.x = element_text(face="bold", colour="maroon", size = 12),
        axis.title.y = element_text(face="bold", colour="maroon", size = 12),
        legend.title = element_text(face="bold", size = 10))
References
http://stackoverflow.com/questions/16074440/r-ggplot2-center-align-a-multi-line-title
A good book is R Graphics Cookbook by Winston Chang.