How To Trade On Poloniex: A Look At The Built-In Trading Indicators (14 Min Video Tutorial)
Hey guys, yesterday we looked at how to read trading graphs over at Bittrex and today I thought we should do the same for Poloniex.
Poloniex is a larger crypto exchange, but it has fewer cryptos than Bittrex.
We will look at the Ethereum price vs Bitcoin and use these indicators/tools:
Fibonacci levels (really useful and user-friendly on Poloniex)
Bollinger Bands
MACD
Candlesticks (daily)
Moving Averages
Volumes
Here is the video:
We will also make some comparisons between Bittrex and Poloniex. In my opinion you can use both together but overall I think Bittrex is more user friendly and broader. I get the feeling that Poloniex should be used for short term trading, thats probably why you cant pick weekly or monthly candlesticks.
However, I really like their automatic fibonacci level tool. Honestly, I have not seen this feature before and in my opinion this feature alone could make it useful for you. If you want to use the fibonacci level, all you have to do is to go to the upper left corner and click the settings buttom and then select the fibonacci level.
Here is a screenshot once you have selected this option:
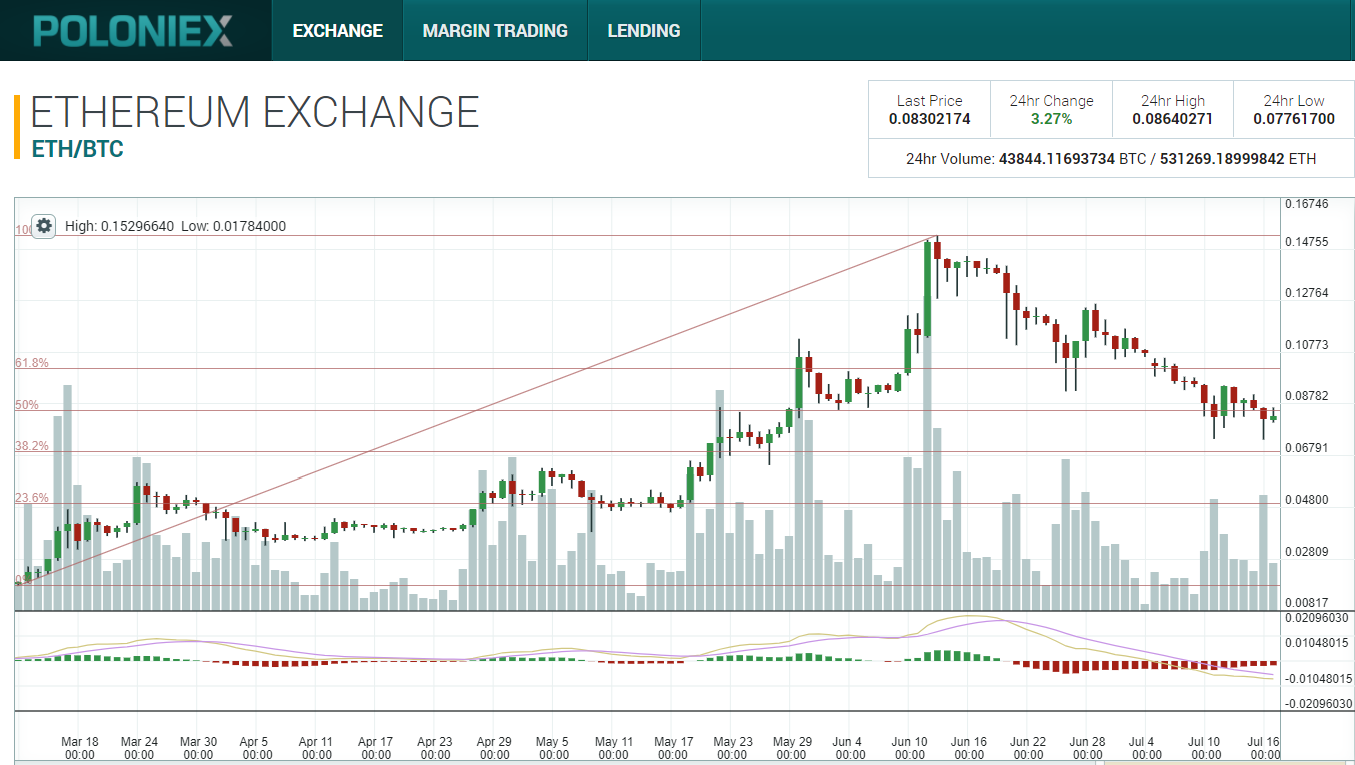
As soon as you have selected the fibonacci level it will automatically draw a line from 100% at the highest price and down to the lowest price which is 0% for this selected time period. However, if you decides to change the time period the fibonacci levels just follow along so you dont have to make any changes what so ever.
These fib levels are super useful, the price has a tendency to gravitate towards these levels and you can use all these different levels to look for support and resistance. Here are the different levels as you can see from the graph:
100% (top)
61,8%
50%
38,2%
23,6%
0% (bottom)
And if you look closely on the graph you can see that Ethereum at the moment is hovering around the 50% area. However, I believe that we could see Ethereum to drop further to the 38,2% level and we also need the MACD to turn green below the 0 level. Hopefully, that could happen during this coming week.
But at the moment it is time to wait for a buying signal and in terms of old buying signals, we had one back in April 27th when the MACD was below 0. I have circled that area in this screenshot:
.jpg)
Anyways, thats all for now, I hope that you have enjoyed this tutorial and if you want to look at the the Bittrex Tutorial you can just go to that post here:
Finally, if you are curious about Poloniex you can head over there and see for yourself:
https://poloniex.com/exchange#btc_eth
Happy trading!
Thank you for being honest. Bitterx is a much better trading platform compared to polinex. It has more trading instruments, more technical analysis tools and great support.
you are welcome
Going to watch this later today thanks
cool
good info for people not familiar with the exchange :)
thx, yeah, there is always a first new user/trader