Terrorism Data (a lesson in data journalism) [OC]
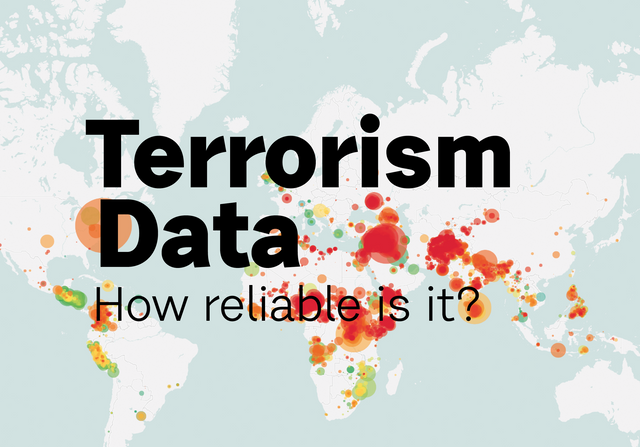
Since 1970, the Global Terrorism Database has collected more than 150,000 individual data points on acts of terrorism. Watch the video below, and you'll have a good idea of how terrorism developed globally according to the largest and most consolidated database in existence.
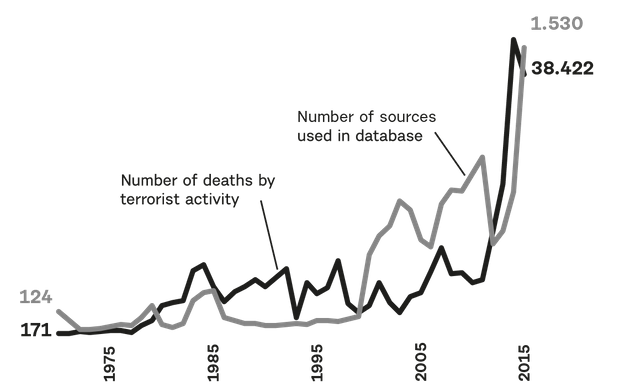
At first glance, it seems as if terrorist activity is growing dramatically - as the death toll, particularly in Iraq, Afghanistan and Nigeria has grown exponentially in the past decade.
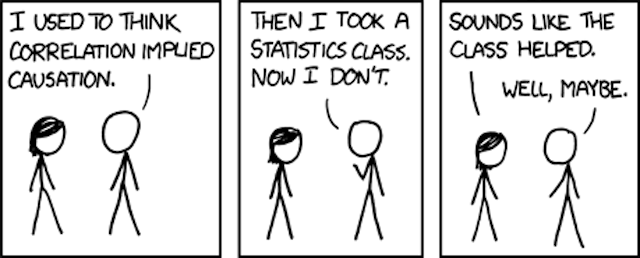
But how do we know that's really the case?
An important lesson of data journalism: Always look at how the database was constructed.
In this case, any interpretation based on the obvious growth in terrorism might be misleading, as the database is old and has had numerous methodological amendments as well as lived through incredible technological innovations.
Here's why we shouldn't be so quick to jump to conclusions:
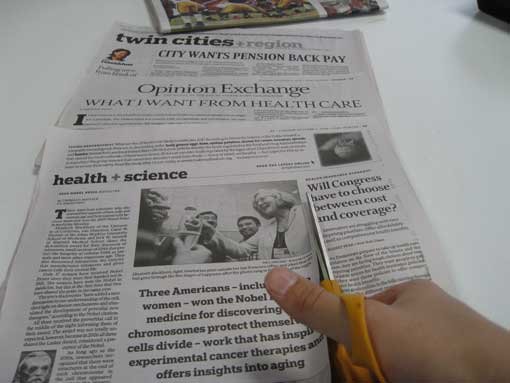
The database was started in 1970. And you can imagine the data collection process back then might have looked something like this:
Fast forward to today, into a world of globally integrated media enterprises and machine learning algorithms. So if a car blows up in rural Pakistan, the database may not have captured it as an event in 1983, but they certainly will have known about it today.
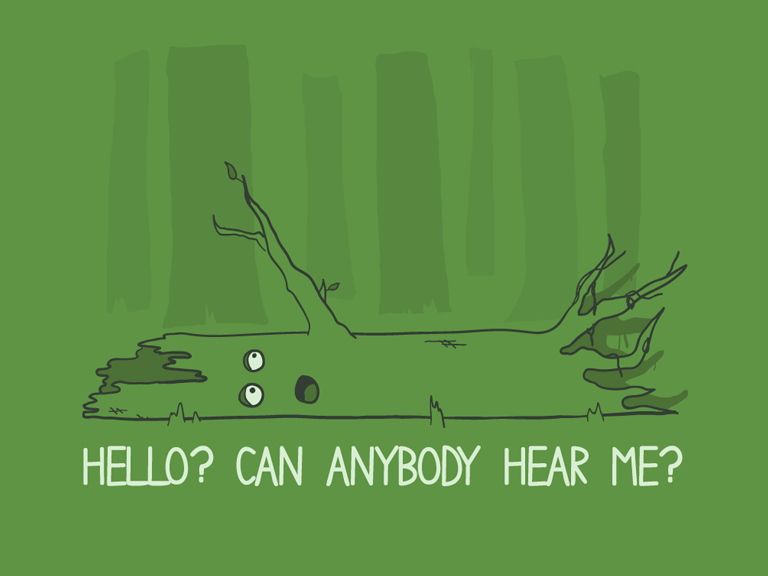
The advent of the internet, globalised media and social media have all had significant impacts on observable year-to-year trends in the data, especially as these have developed asymmetrically across the globe.
In this graph, we see how the number of sources used in the database fits snuggly to the number of deaths by terrorist acts.
The GTD is the most comprehensive and widely used dataset on terrorism by policymakers and journalists. Unfortunately they don't always read the fine print and instead take the data at face value. Such conclusions drawn on "hard data" can easily be abused by influential people looking for "evidence" to support fear-mongering strategies. Let's be vigilant, fellow data journalists :).
Data Source: "National Consortium for the Study of Terrorism and Responses to Terrorism (START). (2017). Global Terrorism Database [Data file]. Retrieved from https://www.start.umd.edu/gtd"
This type of bias is well-known and also applies to many areas like disease incidences (in the past the diagnosis methods were not that advanced, like here the search methods). If your conclusion is that terrorism is NOT increasing, then this message is equally flawed. First of all, there is no evidence that in absolute numbers it is not increasing, as we can´t really compare for the reasons you have mentioned, and secondly, I find such a message too much smelling like appeasement. It could be used by the "Gutmenschen" to say "see, it is not worsening, this is just a statistic artifact". In fact, I don´t care if it is worsening or not as this is not the point. The point is that such acts do happen, and they happen too often, and we should do whatever is possible to not have them happen by not supporting ideologies and groups working indirectly towards terrorism (I include here our government, lefties, etc)! To call information about terrorism acts "fear mongering" is cynical, please tell it to the victims.
Thanks for your input! You make a very valid point that it can be used to fuel the "downplaying" of terrorism as well. However, I have to correct you that i am cynical in that I
I merely said that often what looks like "hard data" can be abused to stir fear among people.
Here, I am only hoping to communicate to anyone interested in data journalism or using data sources in journalistic ways, to simply take a deeper look before drawing conclusions.
Hey Remus, found your post through Reddit, great article! This is the kind of blogs we like here, just keep it up, you'll get a following and bigger rewards soon.
(btw don't forget to engage with others in the community, relation building helps a lot!)
Thanks for the tips! Will do my best :)
If you ever need any help around here, just mention me in some comment somewhere (@fitzgibbon), I'll be in touch.
Thank you very much :) I'll keep that in mind.
@fitzgibbon I would actually really like to develop the Data visualisation community around here. Nothing is happening at #dataisbeautiful currently. Do you have any ideas how I might go about it? Thanks!
@remuslord hi, so data is your thing too then :-) . We have an awesome Business Intelligence Community that is still very young and growing. Do check out the #bisteemit tag. This should be of interest to you and if it is, then we would love to have you as part of the community
Thanks for pinging me @fitzgibbon
Hi @paulag! data is very my thing indeed too :). i will definitely follow the #bisteemit community. i've joined the discord channel now. ping me if you come across any interesting topics for visualisation, perhaps we can collaborate!
get in touch with @paulag, she's really into the steem blockchain data, she'll probably like data visualization very much
maybe talk with @arcange, who set up a public Steem SQL data server
take a look at what's available at steemtools.com (there's a section on data there) - that will also show the steemian that made the tool
Talk with a few data people on steem that you found via steemtools (via steemit.chat or discord), if they like the idea, just make a post with #dataisbeautiful tag and you're off!
Good luck!
(oh and if I say things that aren't clear or you have more questions, feel free to contact anytime)
Wow thanks so much for all the tips :)))
Oh wow, I certainly hope this hasn't been used as a source in the news! That kind of side explanation is easily left out and can be used for all sorts of fear-mongering. Oh that's actually what you just said in the last sentence.
I suppose the only way to draw the conclusion is if they restrict the study to purely the data sources that existed in the past?
(PS, welcome from reddit)
Thanks for reading! :) Yeah, I think that's definitely a legitimate criticism of the database curators at the University of Maryland. They do mention all these limitations about the data collection methodology changes in their notes, but you have to hope that everyone reads the fine print!
Interesting, I would indeed like to see more content like this.
Thanks! I will post something every week hopefully!
very good post and well formated, I've found it on reddit, I am tired to share my posts there without seeing any activity there so I decided to comment people that share their posts on reddit
Great idea, gonna follow suit.
Congratulations @remuslord! You have completed some achievement on Steemit and have been rewarded with new badge(s) :
Click on any badge to view your own Board of Honor on SteemitBoard.
For more information about SteemitBoard, click here
If you no longer want to receive notifications, reply to this comment with the word
STOP@OriginalWorks
The @OriginalWorks bot has determined this post by @remuslord to be original material and upvoted(1.5%) it!
To call @OriginalWorks, simply reply to any post with @originalworks or !originalworks in your message!