You are viewing a single comment's thread from:
RE: Polybius (PLBT) Is Completing a Sideways Correction
Hallo Haejin, thanks to your teaching I came to this chart. What do you think ?
Hallo Haejin, thanks to your teaching I came to this chart. What do you think ?
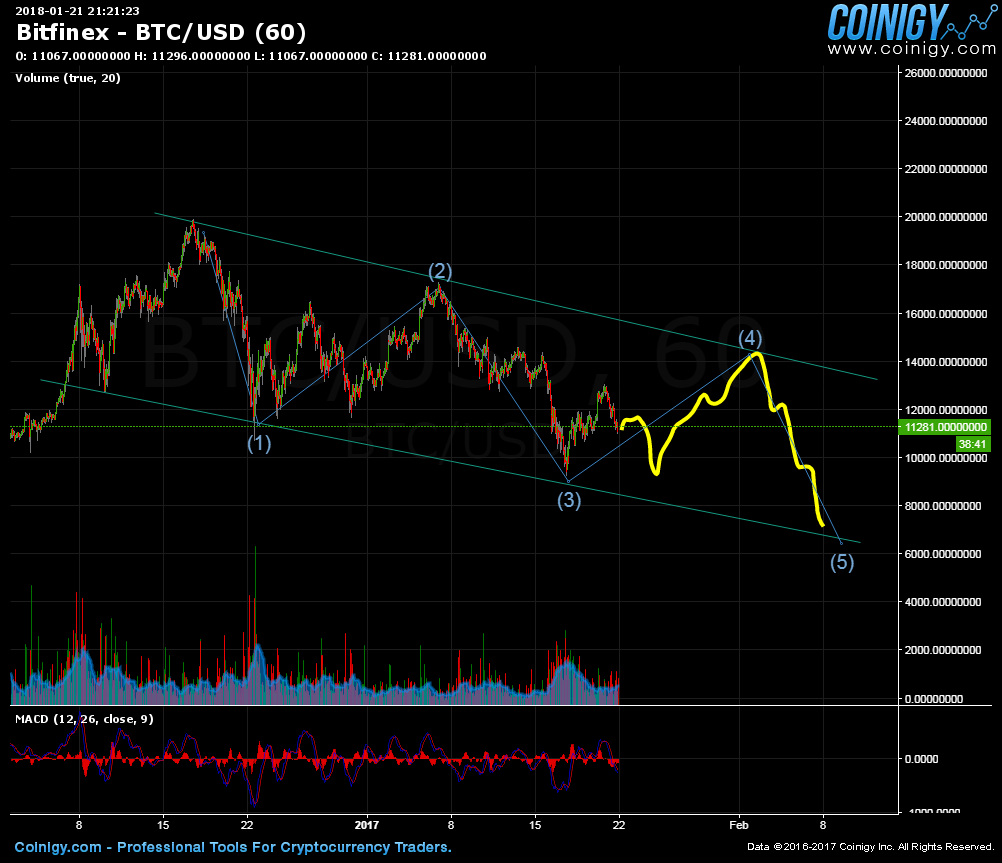
Yes, that's the flag pattern and if price breaches the upper line of the wedge, you blue 4 would be the next stop. Tough, I'd label with a,b,c,d,e
@bjlisteemit i am also following other expert @salahuddin2004 & saw he mention in comments bitcoin will not go that area which mention in this chart? what you think? which one is correct?
charts showing bitcoin will go to 6k?
Chart shows around 6500. I just extended the fractals and came to this chart. From there it should impuls to 20k. However i'm not an expert so we need input from Haejin on this one. @salahuddin2004 thinks it does not go below 10k. However everyone agrees long term trend is up at least towards 20k. This means 2x current levels and alt coins would easily 3x in my opinion. So if you do not want to micro trade the waves you can just sit back and relax.
Nice post! Really like ur profile :)
i think haejin's count is more likely sa the 7 day moving average(white wave) failed to cross the 77 day moving average (blue wave).
great info in detail
haejin TA is like this pile of poo!!

I thought this was ur face , asshole , shall I whip you with a long piece of meat attached to me ?
haejin TA is like this pile of poo!!

haejin TA is like this pile of poo!!

HAEJIN EAT TRIPLE COMBO WOPPER AT BUGER KING,

THEN MY POO POO COME OUT HIS BUNGHOLE
Why don’t you eat my hairy balls 🎾?