Science & Photography: A Little About Thermography
Dear Steemians, today in Science and Photography I want to talk a bit about thermography or better say infrared thermography...
The first thing I want to point out is that an image can be built just by differences in colours or brightness this will create contrast and what finally allows us to see an image is contrasts...
Let’s take as an example an 8 bits black and white photography, these 8 bits mean you have 2 to the power of 8 (256) possible colours and because is black and white we could say 256 tones of grey ...
if we, for instance, assign the number 0 (zero) to the colour black and the number 255 to white, then we have 254 tones of grey left each one with a number between 1 and 254 in where 1 is almost black and 254 is almost white...
Right, now let’s talk about pixels, In the case of a digital image, let’s say for example , 240x240 pixels, it means each pixel can represent a colour ( or a tone of grey in a black and white image), in the case of an 8 bits black and white photography we are talking that we assign a number between 0 and 255 to each pixel... so, if we store all this numbers into a file and we instruct the computer to display a tone of grey equivalent to that number for each pixel then ‘voila’ we have an image…
As a review, we have a ‘big’ square area with 240x240 small close packed boxes forming 240 rows and 240 columns and we paint each box or fill it with a single tone of grey chosen from 256 possible colours (tones)…
Ok, after this very quick explanation about what a digital image is, let’s talk about how I can generate a thermography photography or thermograph, well now image we have an area we want to represent with a thermography image, for the sake of simplicity, lets imagine we have a wall that contains a pipe inside it and hot water flowing through that pipe…
now let’s make an imaginary grid on the wall with 240 rows and 240 columns, then we measure the temperature of each square in the grid, at this point we have 240x240 = 57600 temperature readings …
Ok after this is done, lets imagine the minimum temperature we measured was 18ºC and the maximum was 35°C , now let’s build an image by assigning the colour black to all places in the grid where the temperature was 18°C, white to all where the temperature was 35°C and different shades of grey to all the other temperatures, we have 254 more possibilities, in this way we have a thermograph, if everything was ok we should have an image of the wall in where you can see the hot water pipe cause just where the pipe is inside the wall points should be hotter ….
Now you know what a thermograph is ...
We can use instead of shade of greys a different colour palette, the point is to assign different colours to different temperatures and then you have an image …
Now let’s talk about a thermographic camera, the case is that all bodies (theoretically if its temperature is higher than zero Kelvin which mean all Bodies) irradiate electromagnetic waves with exactly the same nature than visible light, if the body is, lets say, at 25°C the radiation it emits is at a frequency that the human eye cannot detect, this kind of radiation is called Infrared radiation, this will happen from about -273°C until about 273°C, what I want to say is that if temperature is higher than about 273°C the radiation it emits can be seen by the human eye, we start seeing the red radiation and we say that the object is glowing light red , lower temperatures the radiation is infrared… We can see infrared but there are special sensors that do and we can associate this radiation detected to a temperature of the object or the pixel in this sensor, then like a photographic camera sensor that detect light this infrared sensors detect temperature and by a process similar to the one I explained above it generates an image …
The sensibility of the very expensive thermography cameras can be as high as 0.05 ºC meaning you can detect differences in temperature like that, this is the reason nowadays thermography is being used with success in medicine to detect some kind of internal injuries or early detection of breast cancer among other applications, it is possible to detect problems in electric circuits (bad connections are hotter) refrigeration system leaks and many many different engineering applications…
I am showing some images of thermographic images
I hope you enjoy the article…
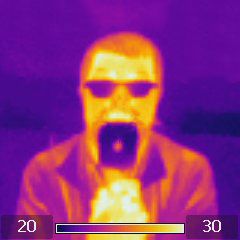
Name: Me in from of the mirror holding the camera
Camera: FLIR Systems AB Z-Camera
Lens: 45° × 45°
Settings: Distant to the object: 1 m. 7 mm ... 1/50 sec
Comment:Although the nature of infrared radiation is the same than visible light there are some interesting differences, for instance in this case you can see my glasses look totally black the reason is that the glass is opaque to infrared radiation (in the range we are using in here) so this radiation is almost totally blocked by my glasses, this is one of the reason you can avoid (at least for a while) heating by radiation if you use a glass in between you and a fire
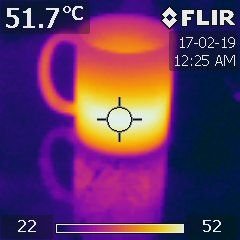
Name: Mug with coffee, Measuring the level of liquid
Camera: FLIR Systems AB Z-Camera
Lens: 45° × 45°
Settings: Distant to the object: 1 m. 7 mm ... 1/50 sec
Comment:Although the nature of infrared radiation is the same than visible light there are some interesting differences, for instance in this case you can see the reflection of the Mug on the table that has a formica's top which does not reflect the mug in the range of visible light
Yes, I enjoy your article so much. Thanks (I like the cup of coffee)
Wow thank you very much.... Here it is so weird cause sometimes if you just post a single photo without any comment you find a lot of people looking at your post even more than when you take your time to write and article but let me tell you something... you made my day with that comment hehehe...
Ja ja ja. Well, well. I must to do it frecuently