PHOTOGRAPHY TIPS #3: the Histogram explained [L’istogramma – ITA/ENG]
Tutte le immagini e le foto nell'articolo sono di proprietà dell'autore
l'istogramma
Cos'è l'istogramma? A cosa serve? Perché utilizzarlo? In questo articolo cercherò di spiegarti tutto nel modo più semplice possibile.
All the images and the photos in this post are made by the author
The Histogram
What is the histogram? Do you need it? Why you should use it? With this post i explain just all of this!
Prima di cominciare
Prima di cominciare a parlare dell'istogramma voglio darti alcune nozioni sulla struttura di una fotografia digitale. Sicuramente sai già che una foto digitale è composta da pixel. Il colore del singolo pixel è dato dalla combinazione di tre valori relativi ai tre canali, rosso verde e blu. A seconda del valore prevalente il pixel risulterà tendente ad uno dei tre colori, nel caso di tre valori coincidenti otteniamo un Grigio.
Analizziamo il singolo canale, per esempio il rosso: per valori bassi avremo un rosso molto scuro mentre per valori alti un rosso più acceso e intenso.
Qual è il range di valori ottenibili dal singolo pixel per il singolo canale?
Dipende dal numero di bit... come? Semplicissimo: basta fare 2 elevato al numero di bit. Quindi se ho un'immagine a 8 bit, il valore del pixel, nel canale del rosso, può spaziare da 0 a 255, per un totale di 256 valori, 2 elevato a 8 infatti fa proprio 256. Analogamente per immagini a 14 bit avremo un range da 0 a 16.383 in quanto 2 elevato a 14 fa 16.384.
Lo stesso ragionamento è applicabile ai canali del Verde e del blu. Ti anticipo che da adesso in poi chiameremo Digital Number (DN) il valore del pixel.
Perché usare l'istogramma?
Spesso dopo un pomeriggio passato a fotografare, tornati a casa, ci accorgiamo di come alcune foto, che nello schermo LCD della macchina fotografica sembravano perfette, siano in realtà sovraesposte o sottoesposte. Questo può essere dovuto al fatto che mentre diamo un'occhiata agli scatti possiamo essere in controluce, o magari indossiamo degli occhiali da sole, o semplicemente la luminosità dello schermo è troppo bassa.
L'istogramma da informazioni sull'esposizione e sulla gamma tonale di un'immagine a prescindere da quello che stai visualizzando. Esso permette di valutare la corretta esposizione di una fotografia senza la necessità di guardare l'immagine vera e propria!
Entriamo nel dettaglio...
Cos'è l'istogramma?
Per semplicità analizzeremo prima l'istogramma di un'immagine monocromatica per poi passare al colore, ricorda che in una foto in bianco e nero il valore più basso di Digital Number corrisponde ad un pixel nero mentre il più alto ad un pixel bianco.
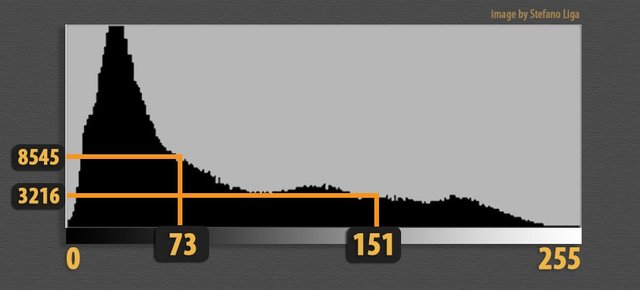
L'istogramma è un grafico che riporta in ascissa i valori di Digital Number (valore del pixel) e in ordinata il numero di pixel che hanno quel determinato DN.
Before starting
Before starting with the histogram I want to talk about the structure of a digital photo. Surely you know that a photo is composed by pixel. The colour of a single pixel is a combination of the three values for three colours: red, green and blue. Based on the prevalence of one of these colours the pixel will tend to that, if the three values are the same, the pixel will be grey.
Let analyze the single colour channel, for example for the red channel: low values correspond to dark red, high values correspond to bright and intense red.
What is the range of values for every single channel (red, green, blue)?
Depend of the “bit” number… you have to do just this: 2 raised to the number of “bit”. If you have an 8 bit image, the pixel value (for example in the red channel) can reach values from 0 to 255, that is 256 values (2 raised to 8 is 256). Similarly if you have an 14 bit image the pixel value can reach from 0 to 16383.
The same goes for the green channel and the blue channel. From now on we’ll call the pixel value “Digital Number” (DN).
Why you have to use the histogram?
After a photography-walking, it may happen that some photos, that looked nice to you in the LCD screen of your camera, are overexposed or underexposed: this can happen cause, while we whatch the photo on the camera, we can be in backlight, we can wear sunglasses, or the bright of the screen is just low.
The histogram give information about the image exposure regardless of what you see on the screen, it allows you to valuate the right exposure of the photo even if you don’t look at that!
Let’s go into detail…
What’s the histogram?
Let’s analyze first an histogram of a monochromatic image
In a B&W photo the black pixels have a Digital Number equal to 0 and the white pixels have a DN equal to 255 (if it’s an 8 bit image).
The histogram is a chart with the DN values in the abscissa and the number of pixel with that value of DN in the ordinate.
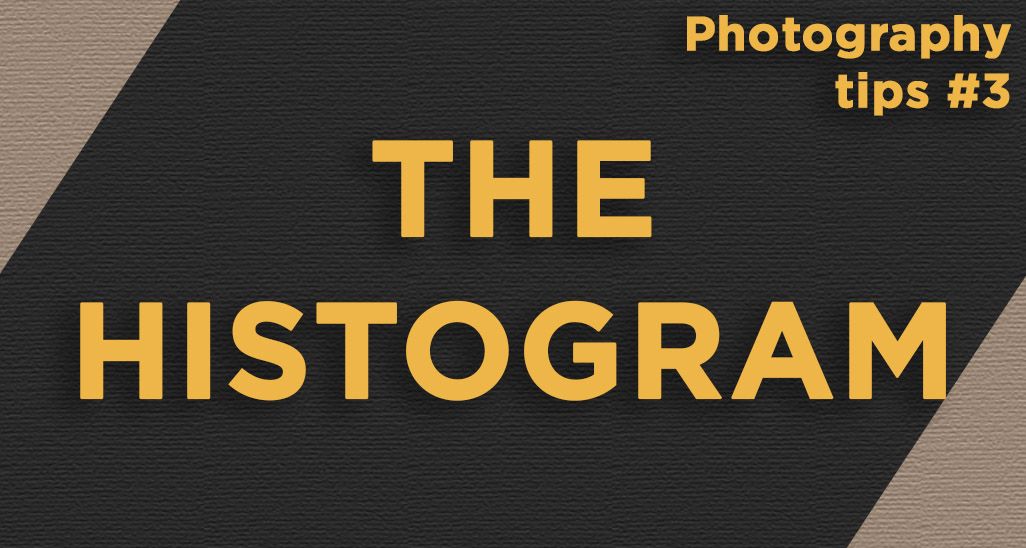
Supponiamo quindi di avere un'immagine in bianco e nero a 8 bit, come va interpretato l'istogramma? Semplice: Nell'intera immagine i pixel con un DN pari a 73 (Grigio scuro) sono 8545, quelli con un valore di DN pari a 151 sono 3216!
Ciò significa che le zone di picco dell'istogramma sono rappresentative di valori di DN molto presenti nell'immagine.
Esempi pratici
Supponiamo di avere un istogramma con un picco spostato verso sinistra
Suppose you have an 8 bit image in black and white, how can you interpreti t? In the example histogram in the figure, you have 8545 pixels with a DN equal to 73 and 3216 pixel with a DN equal to 151!
It means that in the peak zone of the histogram a lot of pixels have that DNs.
Examples
If you have an histogram with the peak on the left
Cosa Significa? La maggior parte dei pixel hanno un valore di DN basso, è probabile quindi che l'immagine sia sottoesposta. Analogamente un istogramma spostato verso destra ci dice che l'immagine presenta una maggioranza di pixel chiari e che quindi è probabilmente sovraesposta.
Se hai ancora qualche dubbio la prossima immagine dovrebbe chiarirti tutto
It means that the majority of the pixels have a low value of DN and probably the photo is underexposed. On the other hand an histogram with the peak on the right telll us that the majority of the pixels are birght and, probably, the image is overexposed.
If you have still some doubt look at the next figure
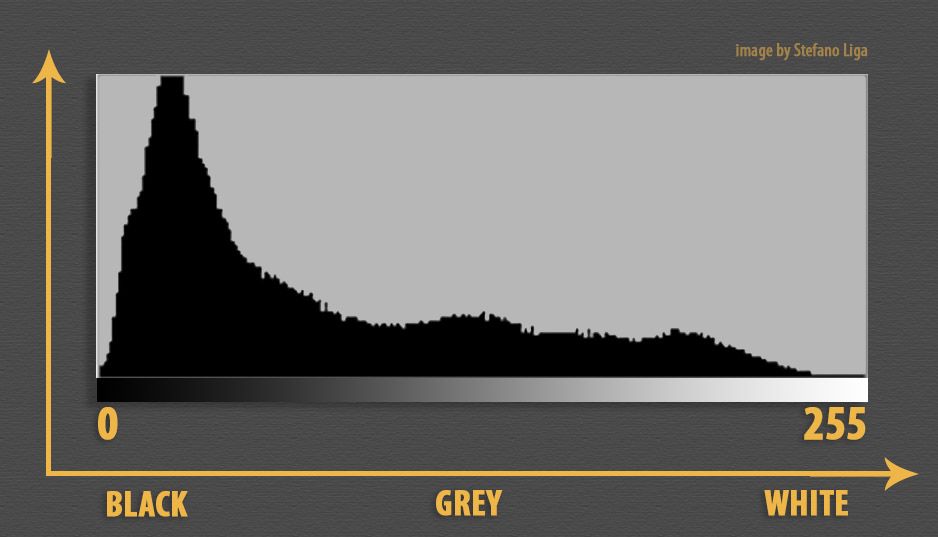
L'istogramma può essere suddiviso in tre parti: a sinistra abbiamo un picco in corrispondenza dei Neri, questo gruppo di pixel si riferisce alle gambe e alle scarpe nella foto. All'estremo opposto, sulla destra, c'è un altro picco, esiste quindi un gruppo di pixel molto chiari o bianchi: la bici e la striscia di vernice. Infine la zona compresa tra i due picchi di estremità è relativa a tutti gli altri pixel dell'immagine che, come possiamo vedere, coprono quasi tutta la tonalità di Grigio, questo si traduce in assenza di picchi marcati e anzi in una curva piatta e ben distribuita.
Adesso sei in grado di interpretare al meglio un istogramma di un'immagine monocromatica! Ma cosa succede nelle immagini a colori?
Istogramma di immagini a colori
Come sappiamo una foto a colori è composta da tre strati (Layer) di pixel: uno per il rosso, uno per il Verde e uno per il blu, Ognuno di essi ha il proprio istogramma! Quindi se analizziamo l'istogramma per esempio del rosso, valgono tutte le considerazioni fatte finora, un DN=0 indica un pixel nero (ma che è nero SOLO nel canale del rosso), un DN = 255, nel caso di immagine a 8 bit, indica un pixel rosso acceso, molto saturo. Analogamente nel canale del blu si andrà da nero a blu acceso e nel canale del verde da nero a verde acceso.
L'immagine che noi vediamo però è data dalla sovrapposizione dei tre strati, quale istogramma vediamo allora? Dipende! Ci sono diversi modi per visualizzare l'istogramma di un'immagine a colori...
Tipi di istogramma
Istogramma dei Colori
è il più semplice, esso infatti non è altro che la sovrapposizione dei tre istogrammi dei tre canali. Per evitare incomprensioni sull'interpretazione le zone di sovrapposizione sono colorate in maniera differente.
We can divide this histogram in three parts: on the left we have a peak relative to the black pixels on the photo (principally the legs of the man). On the right we have a peak relative to the white pixels (the bike painted on the floor). In the central part of the histogram we have all the other pixels, they cover evenly all the grey scale and there is no peak over there.
Now you understand the histogram of a monochromatic image, but… what happens in the colour images?
Colour images histogram
A colour photo is composed by three pixel layers: the red, the green and the blue layer, each with their own histogram! If we analyze the red histogram, all the consideration made for the B&W histogram are valid still here: a DN equal to 0 is relative to a black pixel, a DN equal to 255 (8 bit image) is relative to a bright and intense red. Similarly for the green histogram and the blue histogram.
The final image is made by the overlap of these three layer, and then which is the histogram we see? There are three ways to view the histogram of a colour image…
Types of histogram
Colours histogram
its the most simple, its just the overlap of the three histograms (red, green and blue), to avoid confusion overlapping areas are colored differently.

Istogramma RGB
per costruire questo istogramma il software, per ogni valore di ascissa (DN), si chiede: "quanti pixel hanno questo valore di DN in almeno uno dei tre canali?" la risposta sarà l'ordinata. Quindi per fare un esempio: per il valore estremo di destra (255 per le immagini 8 bit) il software considera tutti i pixel bianchi (255, 255, 255), tutti i pixel Rossi (255, 0, 0), tutti i Verdi (0, 255, 0) e tutti i blu (0, 0, 255).
RGB histogram
for making this histogram to each DN (abscissa) is attributed the number of pixel (ordinate) that have this DN value in at least one of the three channel (red, green or blue). Let’s take an example: for the right extreme DN (255) is attributed all the white pixel (255, 255, 255), all the bright and intense red pixels (255, 0, 0), all the bright and intense green pixels (0, 255, 0) and all bright and intense the blue pixels (0, 0, 255).

Istogramma della luminosità
è quello che solitamente viene visualizzato nello schermo della tua macchina fotografica dopo lo scatto. È il metodo di visualizzazione che più si avvicina alla percezione dell'immagine da parte del nostro occhio e che più ci dice sull'esposizione della foto. Come funziona? Ad ogni valore di DN il software associa un numero di pixel ottenuto da una media ponderata dei pixel nei tre canali...
Mi spiego meglio
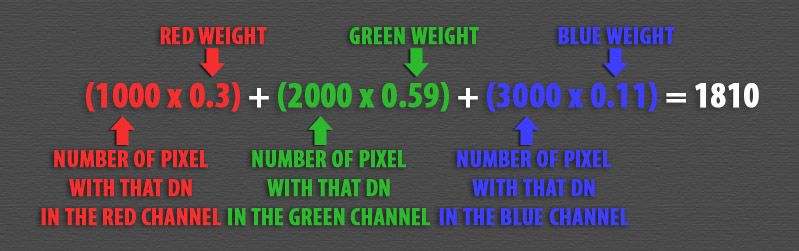
Supponiamo che il valore di DN 125 appartenga a 1000 pixel nel canale del rosso, 2000 pixel nel canale del Verde e a 3000 pixel nel canale del blu, se il software facesse una semplice media aritmetica, al valore di DN 125 attribuirebbe nell'istogramma un numero di pixel pari a 2000. In realtà il software da un peso maggiore al Verde in quanto il nostro occhio vi è molto sensibile e di conseguenza per noi il Verde è un colore luminoso. Al contrario da un peso minore al blu, il nostro occhio infatti percepisce il blu come un colore poco luminoso.
In particolare i pesi attribuiti sono il 59% per il Verde, il 30% per il rosso e l'11 % per il blu. Quindi riprendendo l'esempio precedente, il numero di pixel da attribuire al valore di DN 125 risulta pari a
Brightness histogram
its the histogram that you see on your camera LCD screen. Its the visualization method closer to the perception of light by our eyes. How does it work? For every DN value is attributed a number of pixels derived from a weighted average of pixel numbers in the three channels…
I’ll explain
consider the DN value 125: suppose that in the red channel we have 1000 pixels with this DN value, in the green channel 2000 pixels and in the blue channel 3000 pixels. If we do a an arithmetic average of these three value we get 2000 pixels with this DN (125), but in fact more weight is given to the green channel as our eyes are very sensitive to this colour, while a smaller weight is given to the blue, Our eyes in fact perceive the blue as a light color.
The weights attribute are 59% fr the green channel, 30% per the red channel and 11% for the blue channel. Reminding us of the previous example, the number of pixels to attribute to 125 is equal to

Il Clipping
Quando un'immagine presenta dei pixel con valore massimo, per esempio 255 per 8 bit, è detta clippata sulle luci. Al contrario se presenta dei pixel con valore nullo si dice clippata sulle ombre. Questo perché i pixel con valori estremi molto probabilmente, se le fotocamera lo avesse consentito, avrebbero raggiunto valori ancora più alti (o più bassi) , ma il limite di registrazione della fotocamera li ha clippati a 255 (o a 0).
Molti software offrono la possibilità di evidenziare i pixel clippati, per esempio con Lightroom della Adobe basta cliccare sulle freccette in alto a destra (Clip luci) o in alto a sinistra (Clip ombre).
Clipping
A photo with few pixel white (255, 255, 255) is called “clipped” to the light, if it has few black pixel (0, 0, 0) is called “clipped” to the shadows. This is cause the extreme pixels (black or white), if the camera had allowed, would have reached higher values (for white pixels) or lower values (for black pixels) but the camera clipped them.
Many software highlight the clipped pixels on the image, for example in lightroom (Adobe) you have to click on the top right triangle (pixels clipped to the light) or on the top left triangle (pixels clipped to the shadow).
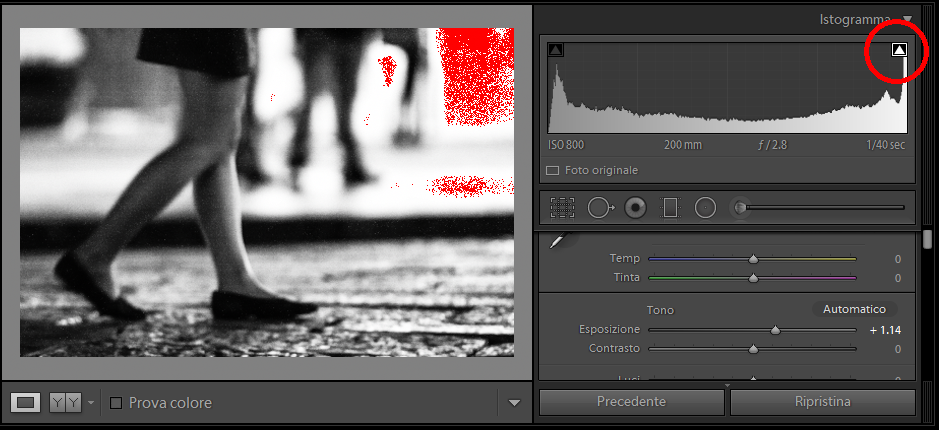
I pixel clippati sulle luci sono stati evidenziati in rosso.
Modifiche sull'istogramma
Cosa succede se modifichiamo un'immagine, per esempio diminuendo l'esposizione o aumentando il contrasto? Ovviamente le modifiche si ripercuoteranno sull'istogramma! Un aumento di esposizione farà spostare l'istogramma verso destra e una diminuzione lo farà spostare verso sinistra.
The pixels clipped to the light are highlighted in red.
Changes in the histogram
What happens to the histogram if you modify some parameters on your photo, for example modifying the exposure or the contrast? These changes affect the histogram! Increasing the exposure value will move the histogram to the right, decreasing the exposure value will move the histogram to the left…
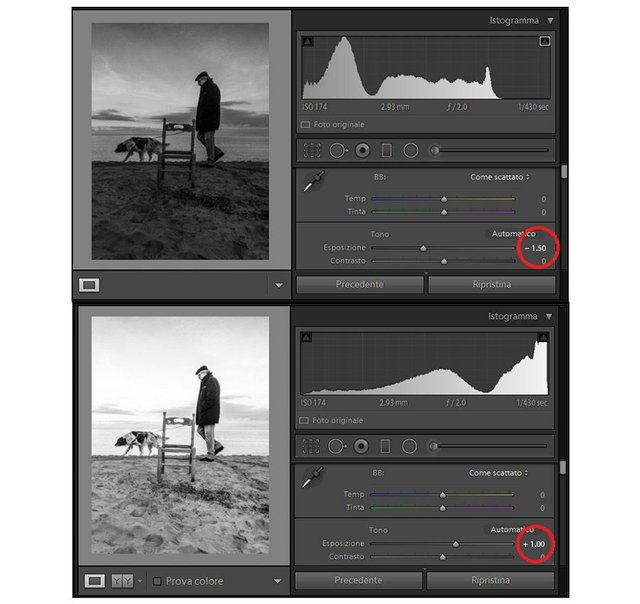
L'immagine mostra la sostanziale differenza tra gli istogrammi nonostante la foto di partenza sia la stessa.
E per quanto riguarda il contrasto?
L'aumento del contrasto agisce sui pixel scuri rendendoli ancora più scuri e sui chiari rendendoli ancora più chiari, questo si riflette in uno stiramento dell'istogramma.
The image show you the difference between the histograms despite the photo is the same.
And what about the contrast?
Increasing the contrast has the effect to make darker the dark pixel and to make brighter the bright pixel. The histogram will be more stretched.
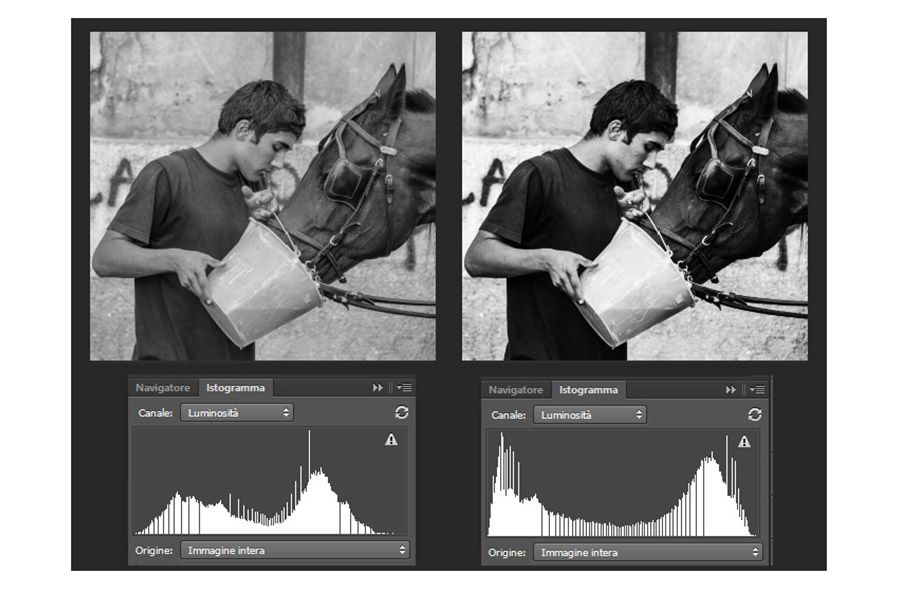
La foto a destra è più contrastata e si nota come l'istogramma sia più "spalmato".
Alcune eccezioni
Abbiamo capito come funziona l'istogramma e abbiamo visto come capire se una foto è sottoesposta o sovraesposta senza neanche guardarla! Ma attenzione, esistono delle eccezioni. Voglio mostrarti un esempio
The photo on the right is more contrasted and his histogram is more stretched.
Some exceptions
We understood how an histogram works and we saw how to understand if a photo is overexposed or underexposed without even looking at it! Be careful, however, that there are exceptions. I want to show you an example
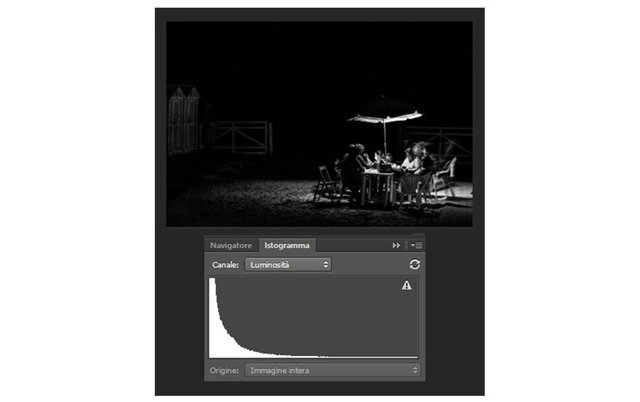
come vedi l'istogramma ci dice "la maggior parte dei pixel è Nera", se analizzassimo solo questo penseremmo a una foto fortemente sottoesposta ma in realtà la foto è proprio come il fotografo la voleva.
questo tipo di immagini è detto low key (in chiave bassa) e ha il corrispettivo nelle high key (in chiave alta) che presentano invece una maggioranza di pixel bianchi. Anche in quest'ultimo caso l'effetto è voluto dal fotografo e la sola analisi dell'istogramma è inutile e anzi può sviare dalla valutazione della correttezza dell'immagine.
Hai capito quindi che l'istogramma non può essere utilizzato come unico strumento di valutazione della corretta esposizione ma che sicuramente è un utile compagno soprattutto negli istanti subito successivi allo scatto.
Spero di averti esposto l'argomento in modo chiaro e visto che sei un amante della Fotografia ti lascio con un pensiero, forse eccessivo, ma comprensibile da chi scatta da molti anni...
Eve Arnold: “I don't see anybody as either ordinary or extraordinary. I see them simply as people in front of my lens”.
As you see the histogram tell us that the majority of the pixel on the photo are black or very dark grey. I f we analyze only the histogram we can think that the photo is strongly underexposed but this photo is just as the photographer wants it.
This kind of photos are called “low key” and they have the opposite in the “high key” photo that have the majority of white or very bright pixels but they are not overexposed. In these cases the analysis of only the histogram makes you miss the evaluation of the photo exposure.
So the histogram is a very useful tool but it isn’t the unique tool for the exposure evaluation and you have to use it paying attention.
I hope you understand clearly the topic and since you are a photography lover I leave you with a quote, a strong thought about photography…
Eve Arnold: “I don't see anybody as either ordinary or extraordinary. I see them simply as people in front of my lens”
Very good tutorial on extremely useful photographic tool @mrliga. Upvoted, resteemed & DPS.
Thanks!
Ottimo, spieghi bene argomenti che non sono facili da far capire!
👍👍👍👍
Grazie!
ottima spiegazione, anche adatta a principianti.
Grazie Nicò
Ora ho capito a che serve !!!
Ma cosa fa, istogrammi?
EH