Measures of central tendency for ungrouped data. Am I ready to learn?
Hello steemians, I'm here to help you guys with your problem in Math regarding statistics.
What is mean? What is the median? What is the mode? This is what statistics was all about. As the fourth quarter embraces, students will tend to hate Math as easy as 1 2 3.
A measure of central tendency is a quantitative representation of the set of data under investigation. This statistic tends to lie within the center of the set of data.
What is mean?
The mean or arithmetic average is the most important , the most useful, and the most widely used measure of central tendency.

That is the formula in finding mean. Mean is equal to summation of x over the number of frequency.
Lets try this example.
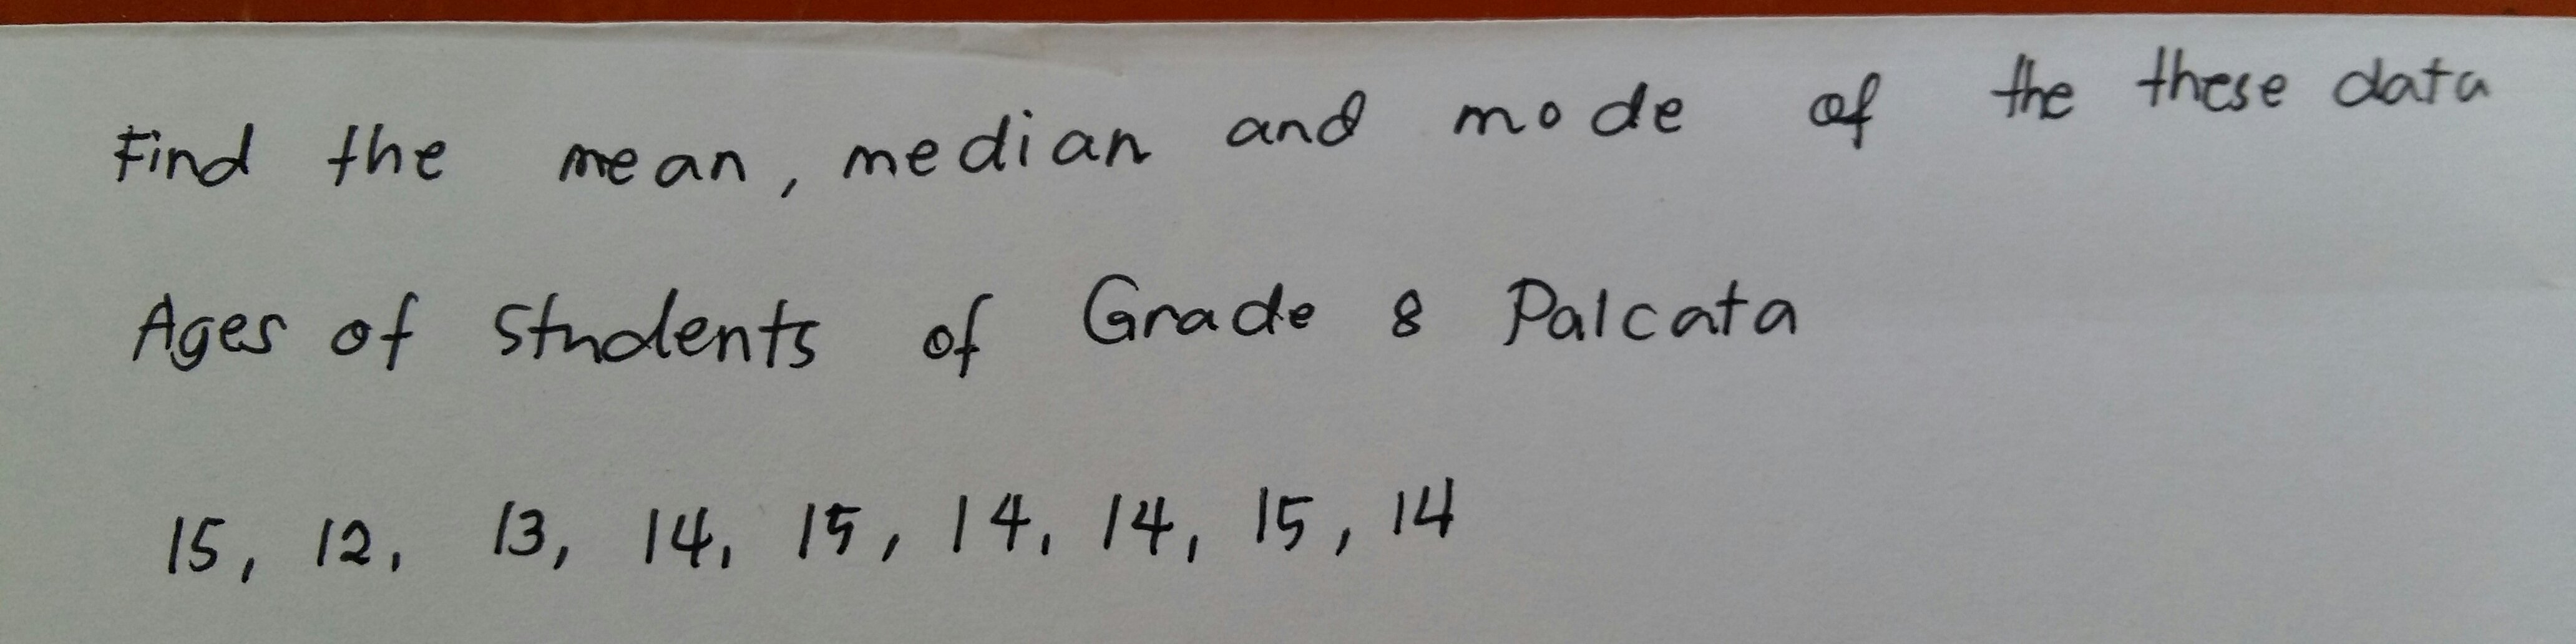
To solve these , add all the data then devided by it to its number of frequency.

See, look how easy it is. Some students my just think that Math subject sucks but come on, it just this easy.
Next is the median. The median is the middle value in the set of quantities. To get the median for ungrouped data you have to arrage the data from smallest to highest and locate the center.

If there ar two median just add it up and devided by two.
Next is the mode. The mode is the quantity with the most number of frequency. So in our problem our mode is 14.
Hope, I can help students with their problems regarding the mean, median and mode for ungrouped data.
Enjoy steemians.
Woah free tutorial nice!