Pattern recognition. Descending Triangle - Defenition - REALTIME PATTERN
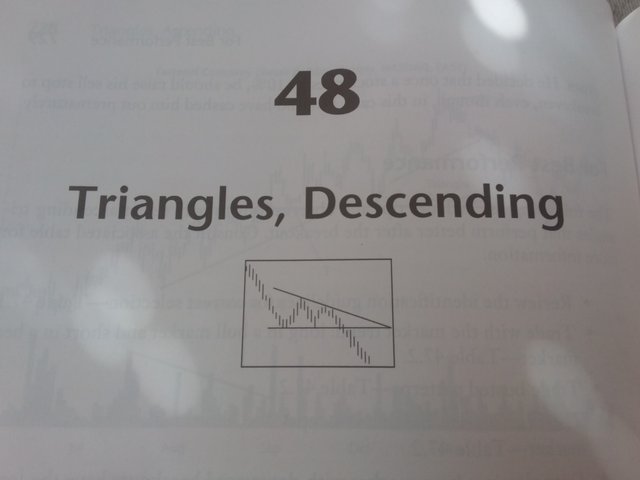
Decending Triangle according to Bulkowski
What is a descending triangle? Should pattern trading be used in crypto? Are they as reliable in crypto as they are in the traditional market?
Many notable online crypto traders will make it known that patterns are the least reliable way to trade signals in the market. Interestingly there are many exceptions to this idea, with some patterns much more reliable in the cryptosphere while others have no place in this space.
One reliable pattern with a track record in crypto has been said to be the descending triangle.

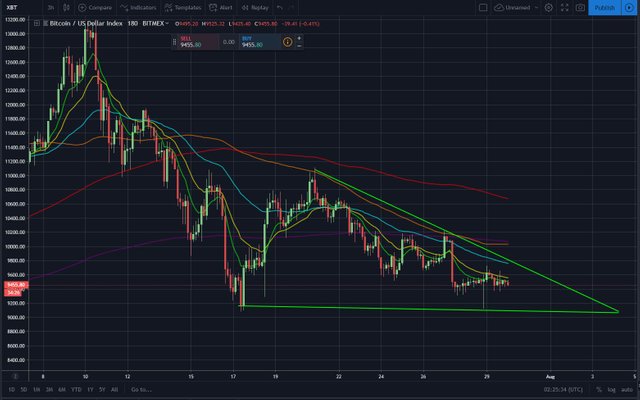
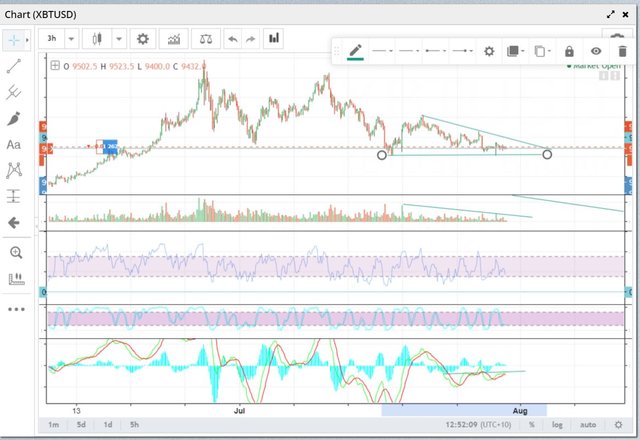
The descending triangle shows lows of the pattern as even in price, with the highs declining to an apex point, lower highs with even lows. Eventuating in a rise or lowering of price on the breakout of pattern, it is said in Bulkowski's book "Encyclopedia of Chart Patterns" that volume typically declines during the pattern with a rise in breakout, though not following this volume profile will not invalidate.
Both tall and narrow descending triangles will show the best result for a bullish breakout.
Downwards breakout failure in bull market is quite high at 16%, it is good to keep note of these statistics when trading a downward breakout.
Downwards breakouts in descending triangles will usually be more prevalent when the pattern appears tall or wide.
Failure of patterns happen!
Breakout failure has been found to be lowest when the pattern is found in a bull market with an upwards breakout, with a 7% failure rate.
Descending triangles have a habit of pre-mature breakout
The pattern is known for pre-mature failure (both bull and bear) which inturn invalidates this pattern, premature breakout can signal an impending trend change.
With a correct pattern and breakout the descending triangle does often pullback to the trend lines once break out direction has been initiated, this will confirm a breakout when the pullback does not break the original trend lines and continues on its path of direction.
Volume
Refering to "The Encyclopedia of Chart Patterns" - it is said that when the volume trends higher during the pattern formation there is a better rate of gains with the patterns that break out the same direction as the current trend, bull market break outs that are upwards have an average of a 57% rise. large break out volume is something to look for in high performance triangles.
For best results Bulkowski says look for breakout day volume that is higher than the previous 30 day average.
Trade Safe
Please feel free to comment
If this helps or you appreciate my input please feel free to donate below!
Bat Token - 0x5671cf84b95283b993ecE520FD1842e1b7005a54
BTC - 12FBY5WgDHshBSce7U6Z1uAzviXnSCwSM2

