Bitcoin (BTC) Price Smashes Resistance: Bulls Target Fresh High
Source: https://www.newsbtc.com/2019/05/25/bitcoin-btc-price-bulls-target-fresh-high/
English below
Bitcoin 가격은 미국 달러 대비 7,800 달러와 8,000 달러를 상회하는 강력한 상승세를 보였다.
- 가격은 견인력을 얻었으며 심지어 8,200 달러의 저항 지역에 가깝게 거래되었습니다.
- 금주에 이어지는 중요한 하락 채널은 BTC / USD 쌍 (클라 켄의 데이터 피드)의 시간별 차트에서 7,960 달러 근처에서 위반되었습니다.
- 쌍은 현재 삼각형 패턴을 형성하고 있으며 8,150 달러와 8,200 달러 이상으로 계속 높을 수 있습니다.
- Bitcoin 가격은 미국 달러 대비 7,800 달러 이상으로 상승했다. BTC는 현재 강세 패턴을 형성 중이며 가까운 시일 내에 8,300 달러로 계속 상승 할 것입니다.
Bitcoin 가격 분석 *
최근 미국 달러 대비 7,475 달러 선에서 비트 코인 가격이 강세를 보였습니다. BTC / USD 쌍은 더 높아지고 7,700 달러와 7,800 달러 근처에서 많은 장애물을 돌파했다. 8,000 달러 수준과 100 시간 단위의 단순 이동 평균 이상으로도 휴식이있었습니다. 황소들이 다시 돌아오고 가격이 $ 7,500의 지원 지역 근처의 하향 조정을 완료 한 것 같습니다. 이것은 또한 8,200 달러 수준보다 많은 이익을 얻을 가능성이 있음을 시사합니다.
최근에 BTC / USD 쌍의 시간별 차트에서 7,960 달러 근처에서 중요한 금리 하락 채널이 금주에 위반되었습니다. 쌍은 $ 8,200 수준으로 급상승하고 $ 8,180에 intraday 최고를 형성했다. 가격은 현재 $ 8,000 이상의 이익을 통합하고 있습니다. 또한, 그것은 $ 8,100 수준과 23.6 % Fib retracement 수준 아래로 7,475 낮은에서 8,180 높이로 상향 이동의 아래 거래. 그러나 7,960 달러와 8,000 달러 수준에 가까운 부서진 저항은 현재 강력한 지지자 역할을합니다.
게다가,이 쌍은 현재 같은 차트에 $ 8,050 근처에 저항력이있는 삼각형 패턴을 형성하고 있습니다. 따라서이 쌍이 삼각형 저항을 제거하고 $ 8,100 이상으로 급상승하면 다음 세션에서 견고한 이득을 얻을 수 있습니다. 다음 키는 8,200 달러와 8,300 달러 수준 근처의 저항 영역입니다. 이보다 높은 가격은 2019 년의 높은 가격으로 거래 될 것입니다.
Bitcoin 가격 분석 BTC 차트
차트를 보면 비트 코인 가격은 분명히 7,800 달러 이상의 긍정적 인 영역으로 다시 뛰어 올랐습니다. 현재 8,000 달러 수준과 100 시간 SMA 이상의 이익을 통합하고 있습니다. 100 시간 SMA 아래에 단점이 있다면 가격은 7,710 달러 수준으로 낮아질 수 있습니다. $ 7,710 이하로 다음 키 지원은 $ 7,650 수준에 가깝습니다.
기술 지표 :
시간별 MACD - MACD는 현재 약세 지역에 있지만, 완고한 지역으로 되돌아 갈 수 있습니다.
시간별 RSI (Relative Strength Index) - BTC / USD의 RSI는 몇 가지 긍정적 인 신호로 50 단계를 유지합니다.
주요 지원 수준 - $ 7,800 다음에 $ 7,710.
주요 저항 수준 - 8,050 달러, 8,200 달러 및 8,300 달러.
- Bitcoin price started a strong rise above the $7,800 and $8,000 resistances against the US Dollar.
- The price gained traction and even traded close to the $8,200 resistance area.
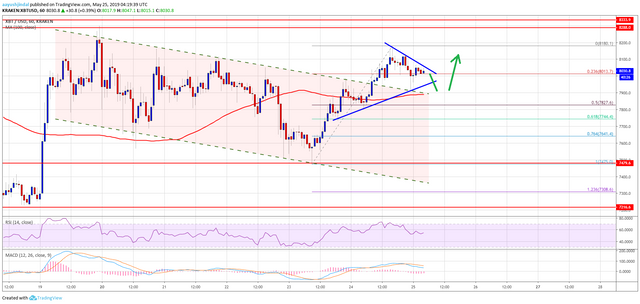
- This week’s followed important declining channel was breached near $7,960 on the hourly chart of the BTC/USD pair (data feed from Kraken).
- The pair is currently forming a triangle pattern and it could continue higher above $8,150 and $8,200.
Bitcoin price jumped back into a positive zone above $7,800 against the US Dollar. BTC is currently forming a bullish pattern and it may continue to rise towards $8,300 an 8,500 in the near term.
Bitcoin Price Analysis
Recently, we saw a strong bounce in bitcoin price from the $7,475 swing low against the US Dollar. The BTC/USD pair surged higher and broke many hurdles near $7,700 and $7,800. There was even a break above the $8,000 level and the 100 hourly simple moving average. It seems like the bulls are back in action and the price completed a downside correction near the $7,500 support area. This also suggests that there are chances of more gains above the $8,200 level.
Recently, this week’s followed important declining channel was breached near $7,960 on the hourly chart of the BTC/USD pair. The pair spiked towards the $8,200 level and formed an intraday high at $8,180. The price is currently consolidating gains above $8,000. Moreover, it traded below the $8,100 level and the 23.6% Fib retracement level of the upward move from the $7,475 low to $8,180 high. However, the broken resistance near the $7,960 and $8,000 levels is currently acting as strong support.
Besides, the pair is currently forming a triangle pattern with resistance near $8,050 on the same chart. Therefore, if the pair clears the triangle resistance and surges above $8,100, there could be solid gains in the coming sessions. The next key resistances area near the $8,200 and $8,300 levels. Above these, the price is likely to trade to a new 2019 high.
Bitcoin Price Analysis BTC Chart
Looking at the chart, bitcoin price clearly jumped back into a positive zone above $7,800. It is currently consolidating gains above the $8,000 level and the 100 hourly SMA. If there is a downside break below the 100 hourly SMA, the price could correct lower towards the $7,710 level. Below $7,710, the next key support is close to the $7,650 level.
Technical indicators:
Hourly MACD – The MACD is currently in the bearish zone, but it could move back in the bullish zone.
Hourly RSI (Relative Strength Index) – The RSI for BTC/USD is holding the main 50 level, with a few positive signs.
Major Support Levels – $7,800 followed by $7,710.
Major Resistance Levels – $8,050, $8,200 and $8,300.
Congratulations @fn109zop! You have completed the following achievement on the Steem blockchain and have been rewarded with new badge(s) :
You can view your badges on your Steem Board and compare to others on the Steem Ranking
If you no longer want to receive notifications, reply to this comment with the word
STOPVote for @Steemitboard as a witness to get one more award and increased upvotes!
@fn109zop This article does not seem to match the NOTICE topic. It would be better if you subtract the NOTICE tag. Thank you.