North Korean Nuclear Weapons – Just How Powerful Are They?
With all that has been written about North Korea wanting to conduct their 6th nuclear test, I have not seen anybody in the mainstream media so far really explain just how powerful their devices are, as based upon their previous 5 tests. As a result, I just wanted to give everybody the best answer, based upon the best data we have.
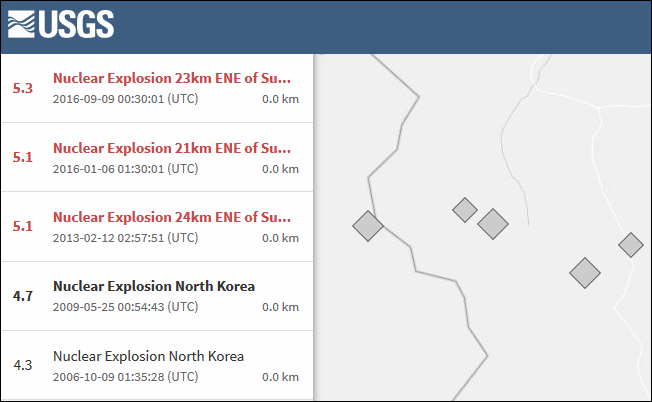
Here then I will draw your attention to the fact that the US Geological Survey has listed on their own website, the seismic signatures of all 5 tests that North Korea has so far carried out.
The precise Richter scale values are given as follows:

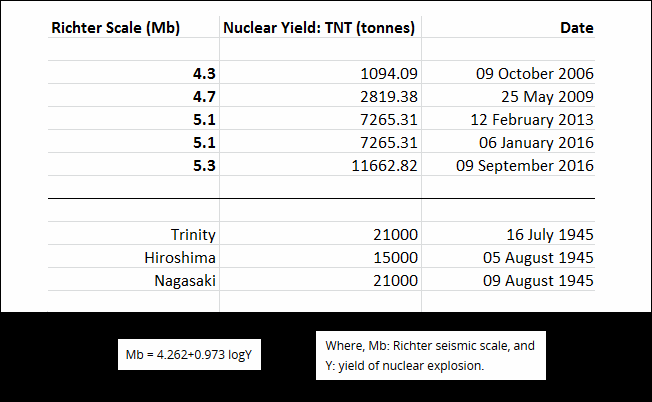
Now when they set off the first one in 2006, scientists began examining the seismic signatures, and converting them into TNT nuclear weapons yields.
There is a specific formula used for this purpose. In the table below I reproduce the formula, and I list all of the North Korean tests, and use the formula to derive the yield values of their tests, in terms of tonnes of TNT.
You can also see for comparison, the TNT yield values of certain known nuclear events. Specifically, the first 3 devices used by the USA: The Trinity test, and the bombs used against Hiroshima and Nagasaki in 1945.

The upshot of this is that North Korea, based upon their last test in September of 2016 – just last year – with a seismic value of 5.3, has achieved, with a yield of some 11662 tonnes of TNT, close to parity with the early devices of the US.
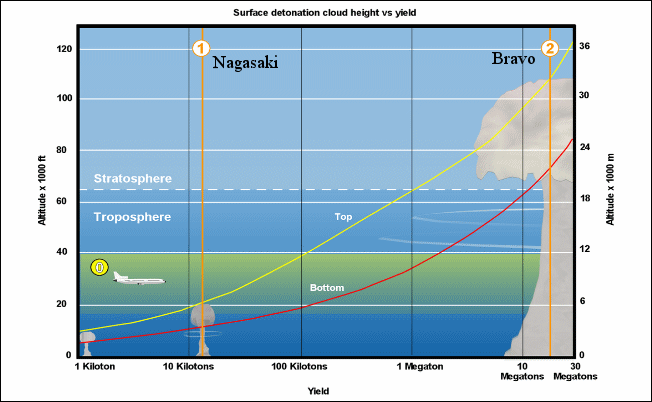
In terms of scale, one may see just where North Korea is from the following diagram (below). The size of their devices, were they deployed, would be close to that of Nagasaki on the left. This is of course very far removed from the blast on the right, which is the US test: Bravo, with a yield of some 15,000,000 tonnes of TNT!

If you want to know more about the esoteric physics behind nuclear weapons though, a recent video I made for my You Tube Channel explains this:
- Keith