Analytical Thoughts on the NFL Season 2019
This is a statistical thought I had recently. It may already be completed elsewhere, but I was not able to find it for free. What I wanted to do was look at :
- An offensive team’s starting position of every discrete offensive drive on the field
- That team’s subsequent outcome (outcome being a punt, touch down, field goal, etc.)
So if my beloved Green Bay Packers started out on their own 25 yard line, and ended up scoring a touchdown, I wanted to know:
- How many times do all NFL teams score a touchdown when starting a drive on their own 25 yard line, on average
- How many times do all NFL teams score a field goal when starting a drive on a their own 25 yard line, on average
- How many times do all NFL teams not score a point when starting a drive on a their own 25 yard line, on average
I am firmly of the mindset (and it’s just my opinion!) that in the current NFL game, no matter how good an opposing defense is, a truly well run and efficient offense should score points. I know that sound like blasphemy to some, but given the fact that all these offensive coaches grew up playing football video games, points should always be engineered to be manufactured. A game in the NFL should always be evaluated on how well an offense performed; not how well a defense performed.
Like I said, blasphemy.
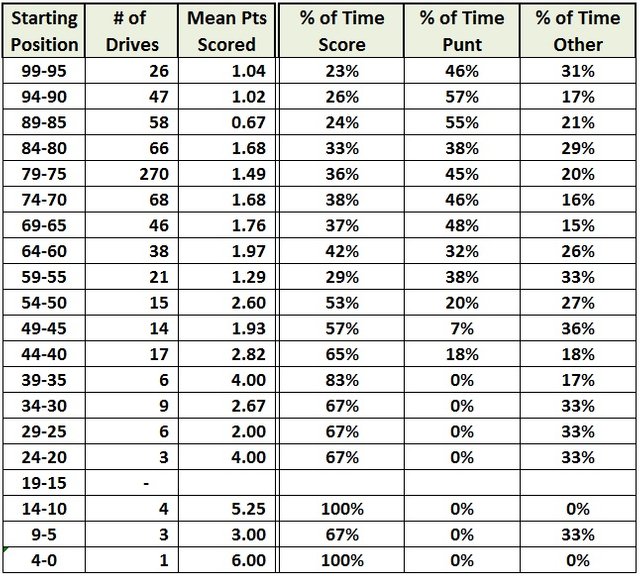
With the assumptions in place, through week 2 of the NFL, I tabulated the following matrix below:
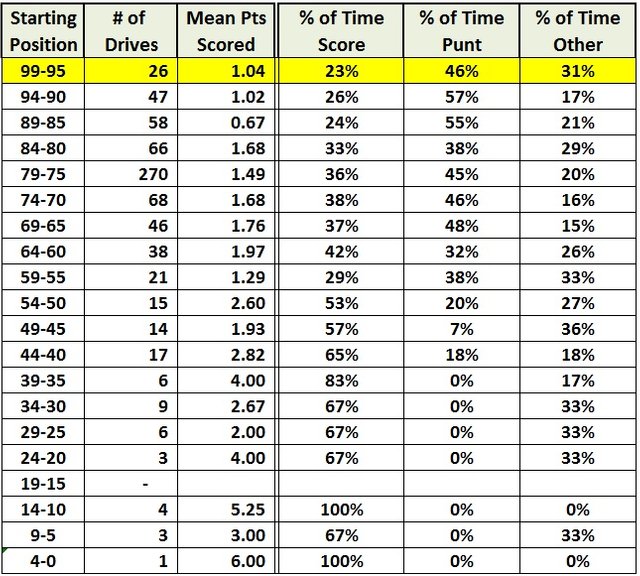
How to read this? If we look at the yellow highlighted row below:
It means that there have been 26 drives in the 2019 NFL season that have started between their own 1 and 5 yard line (implying they have 99-95 yards to move the ball). Of these 26 drives, the mean points scored equals1.04 pts. The breakout of outcomes shows that:
- 23% of drives result in a touch down or field goal
- 46% of drives result in a punt
- 31% of drives result in a turnover, end of game, safety, etc.
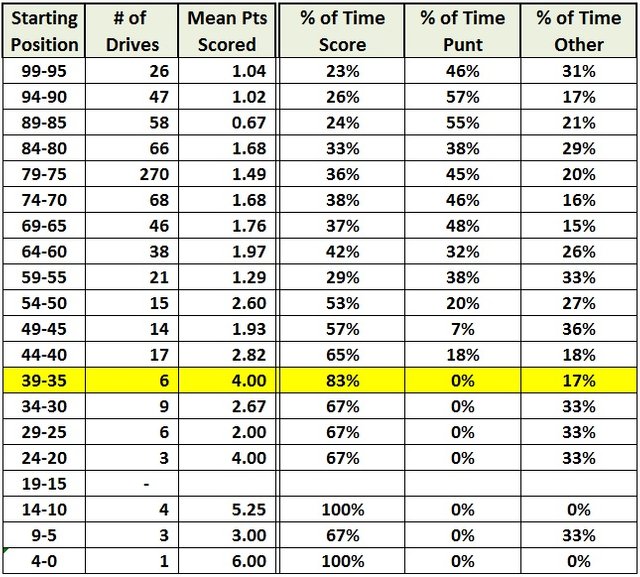
If we look at this highlighted row:
Should a NFL team start on their opponent’s 35 yard line, expect that team to score, on average 83% of the time with a mean 4 pts scored. Easy enough, right?
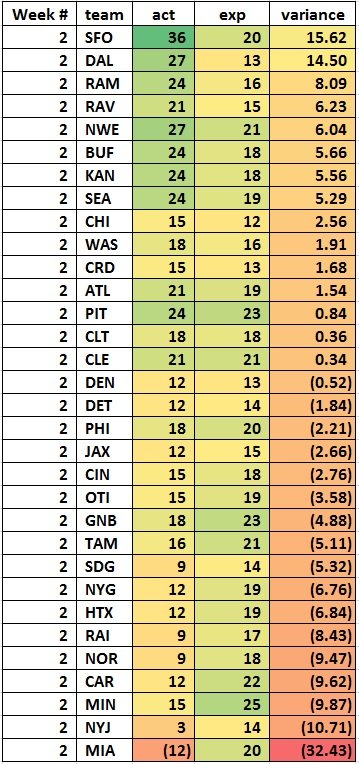
I then ran every team’s week 2 drives through this matrix, and came up with a total expected points scored versus actual points scored. The outcome of week 2 looks like this:
From the above table, San Francisco scored 36 points (excluding PATs, 2 point conversions, and SF defensive pick 6’s) versus an expected score of 20.51739 points. That would highlight that San Francisco did very well against the Cincinnati Bengals based on, again, their starting position on the field per each offensive drive, and points actually scored versus league averages.
If I look at my Green Bay Packers, they should have scored a league average 23 points, but only scored 18 points. Awful; yeah, the Vikings have a good defense, but Green Bay’s offense was well below the league average based on the team’s starting position per drive.
The top 5 offensive teams were San Francisco, Dallas, Los Angeles Rams, Baltimore, and New England ; the bottom 5 offensive performances included Miami, New York Jets, Minnesota, Carolina, and New Orleans. Now, whether this is an indication of how poor the offense truly is, how great the opposing defense is, or some combination of the two, is yet to be seen. Over time, I’m hoping a trend develops.
Top Five/Worst Five Offensive Teams to Date
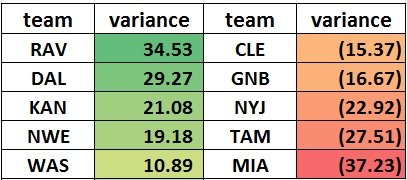
With this same methodology in place, the top 5 and bottom 5 teams are as such through week 2 :
Most of us how have a passing interest in football wouldn’t be surprised about seeing Kansas City or New England in the top 5, but Baltimore? And no real surprise that the bottom 5 includes my hapless Green Bay Packers. Again, they’ve played two good defenses, but their deficit is alarming.
Season To Date Play Calling Charts
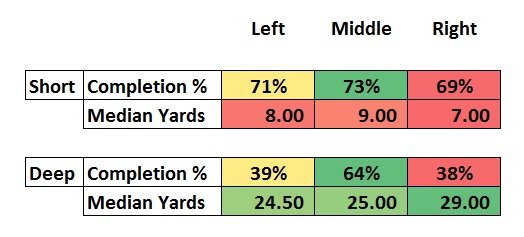
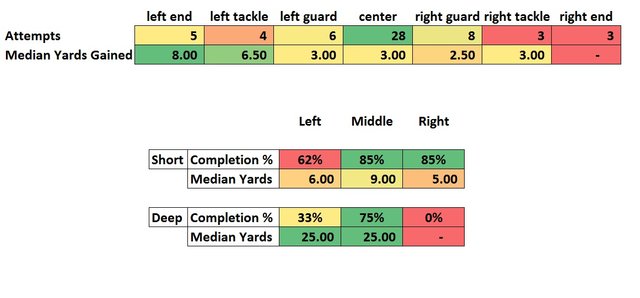
Here is what the NFL currently looks like from a play calling standpoint. The rushing matrix is:
The passing matrix is:
Year to date, team have a very good success with a deep pass to the middle in respect to both percent completion and yards gained.
Green Bay Preview Week 3
My beloved Packers play the Denver Broncos next week. Denver is middle of the road in respect to offensive output at 14 in the league; Green Bay is 29th in the league. Let’s see what offenses have done against Denver through week 2.
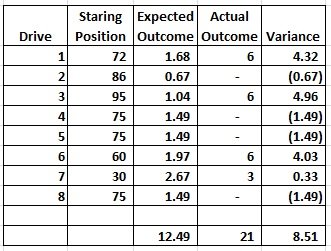
The Raiders did very well against Denver, scoring +8.51 against league average based on their scoring position.
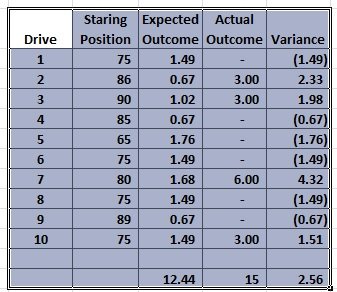
The Bears in week 2 scored +2.56 pts against league average based on their starting field positions.
Play calling and outcomes against Denver’s defense has looked as such:
Expect Green Bay to attack the left side of the field with Aaron Jones and Jamaal Williams. From a passing standpoint, one would expect Rodgers to attack the right side of the field for short yard plays, whereas he'll take a few deep shots down the middle. Just my guess!
My goal is to track this, evolve the data, and add to it as time goes. One could print the league summary tables and use it is as a cheat sheet, each week, while watching their favorite team. Or most hated team. The idea is to give us fans an idea of how well our teams are doing each Sunday/Monday/Thursday in comparison to the rest of league per each drive. It's a thought, anyway.
My hope is to publish each Tuesday after MNF. Please feel free to drop a comment, link, or feedback on this information. I hope to eventually use this to generate some fantasy football implications going forward. Thanks for reading!
