Bitcoin Is Back At $8000 – Can It Finally Break-Up The 2019 High? BTC Price Analysis & Overview
AUTHOR: YUVAL GOV LAST UPDATED ON MAY 25, 2019 @ 08:11 UTC!
Bitcoin Is Back At $8000 – Can It Finally Break-Up The 2019 High? BTC Price Analysis & Overview
On our previous price analysis, we have mentioned the fragility of the $8000 level and that Bitcoin was steady for the past couple of days.
Shortly after, we did see a massive drop below $7500 in Bitcoin’s price. However, following the drop, Bitcoin kept its strength and kept up the $7500 – $7600 significant support level, and since then we saw a bullish move surpassing the $8000 and retesting $8200.
After getting rejected by the $8200 resistance, Bitcoin is back to our previous analysis’ situation, whereas the coin is trading around the $8000 mark.
Total Market Cap: $249.5 Billion
Bitcoin Market Cap: $141.4 Billion
BTC Dominance: 56.7%
Looking at the 1-day & 4-hour charts
– Support/Resistance:
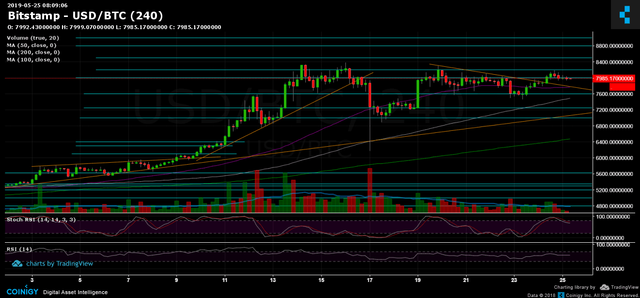
As mentioned, Bitcoin is trading around the $8000 mark. Breaking above and the next barrier is the $8200 and then the 2019 high at $8400 (which got rejected twice so far). The next possible targets or resistance levels are $8500, $8800 and $9000. Further resistance lies at $9600 – $10,000 area.
From below, the closest support lies at this current price level. Below lies the $7800 before getting down to the $7600 support. The next significant support area is at $7200 – $7300. Further below is the $7,000 zone.
– Trading Volume: Following the above, we can see that the volume is not significant. The direction for the coming future hadn’t been decided yet.
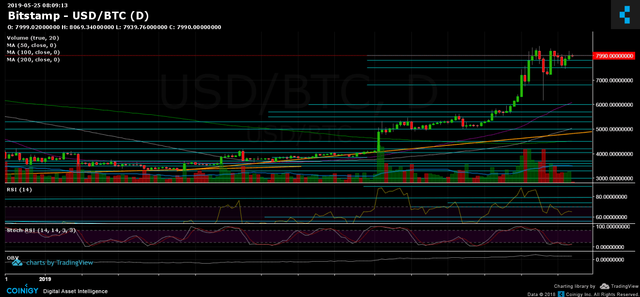
– Daily chart’s RSI: The drop below $7500 is reflected on the RSI, as the indicator dropped to 60 where it found support. The RSI is now around 64, which is relatively low compared to 2019, however, still bullish.
A bullish sign might be coming from the Stochastic RSI oscillator, as it was recently crossing over in the oversold area.
– BitFinex open short positions: there are 19 K BTC open short positions.
BTC/USD BitStamp 4-Hour Chart
btc_may25_4h-min
BTC/USD BitStamp 1-Day Chart
btc_may25_d-min
Click here to start trading on BitMEX exchange and receive 10% discount on fees for 6 months.
Cryptocurrency charts by TradingView. Technical analysis tools by Coinigy.