ANALYSIS COURSE ETH 07/21/2016

Technical analysis of the air - can be traced further growth
Price ether keeps bullish sentiment towards the US dollar. whether a couple will be able to ETH / USD traded even higher?
Key points
Price ether continued to rise against the US dollar and is located above the resistance level of $ 12.00.
Yesterday the idea of buying on the decline worked perfectly, as bulls defend downward movement ETH.
It is evidence of a new bullish trend line formed at the ETH / USD hourly chart (Kraken data) serving as a support area for the pair.
Price ether keeps bullish sentiment towards the US dollar. whether a couple will be able to ETH / USD traded even higher?
Trend rates ether
Price ether continues to gain momentum and break through all the main areas of resistance above $ 12.00. Yesterday, the importance was stressed of 100-hour moving average and 50% Fibonacci of the last wave of rising from $ 10.83 to $ 12.03. Let's hope that this area will be able to make a purchase offer and provide.
Both factors provide the necessary support and pushed the price up. It is evidence of continued bullish trend line shown in ETH / USD hourly chart (Kraken data), which acts as a catalyst for an upward movement, thereby maintaining customers. Recently, the price traded at up to $ 12.86, and is now held its correction.
Technical analysis Live prices
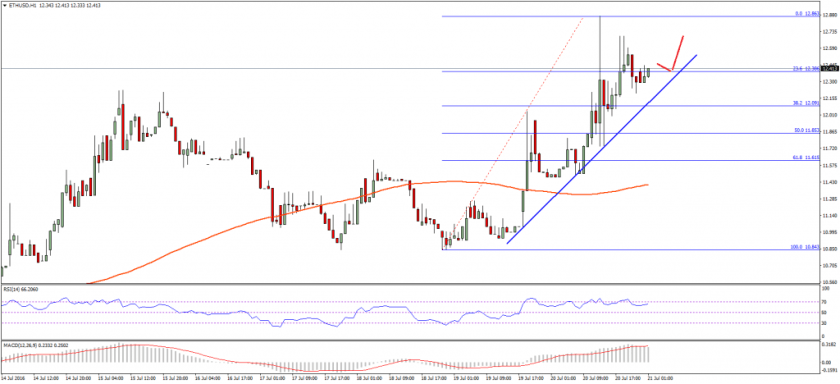
On the other hand, the trend line with the 38.2% Fib at $ 10.84 to $ 12.86 may act as a support area. As long as the price is above the stated areas of support, there is a chance to increase profits in the short term. A break below the trend line could send prices towards the level of 61.8% Fibo retracement of the $ 10.84 to $ 12.86, which can act as a support area.
All MACD - MACD indicator is in bullish zone, calling to obtain additional income in the ETH.
All RSI - RSI is above the 50 level, which is a positive sign for the bulls.
The main level of support - $ 12.10
The main resistance level - $ 12.60