Business Outlook Survey - Winter 2017–18
Business Outlook Survey - Winter 2017–18
Data available as: CSV, JSON, and XML
Results of the Winter 2017–18 Survey | Vol. 14.4 | January 8, 2018
Business sentiment in the winter Business Outlook Survey remains positive: the sales outlook is still healthy, despite some moderation. At the same time, capacity and labour pressures are becoming more apparent and are stimulating firms’ employment and investment plans.
Overview
Expectations for sales activity remain positive but point to some moderation ahead. Following broad-based strength in past sales, many firms expect stable sales growth or a return to a more sustainable pace, particularly in the goods sector and in demand from domestic customers.
Firms plan to expand operations to accommodate sustained demand, which is evident in a rebound of investment and employment intentions since the autumn survey.
Reflecting strong demand and tightening labour markets, indicators of capacity pressures and labour shortages picked up. Survey results suggest that economic slack is now largely limited to the energy-producing regions.
Firms expect growth of input prices to rise, owing to gains in commodity prices. Pass-through of input costs and emerging wage pressures to output prices remains limited due to competitive forces. Inflation expectations are modest and unchanged from the third quarter.
Apart from higher prime rates, credit conditions are largely unchanged.
The Business Outlook Survey indicator rebounded almost to its summer peak, consistent with widespread positive sentiment.
Business Activity
On balance, firms saw an acceleration in the pace of past sales (Chart 1), reflecting recent healthy demand growth, which was broad-based across all regions. The balance of opinion on expectations for sales growth over the next 12 months remains positive (Chart 2, blue bars), with businesses pointing to strong real estate markets, sustained foreign demand and tangible support from federal stimulus spending. The balance of opinion has moderated further from its peak in the summer, however, reflecting many firms’ views that sales growth will return to more normal levels following its recent strength, which businesses often qualified as unsustainable.
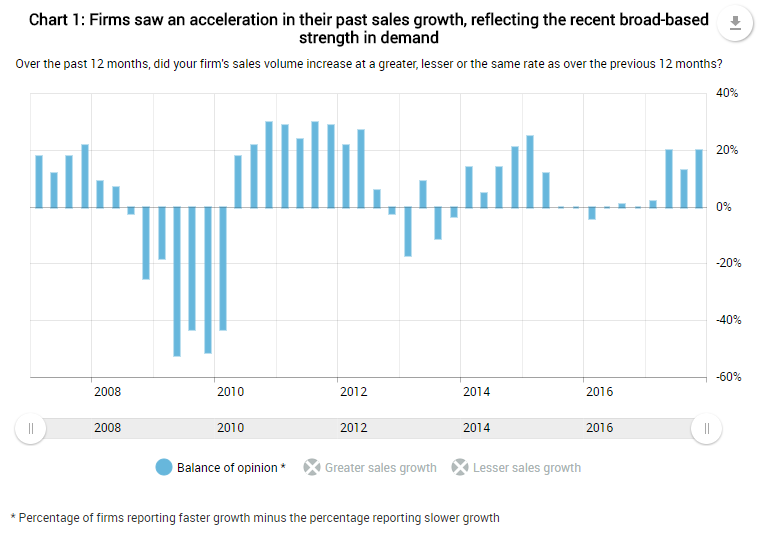
Chart 2: The outlook for future sales remains positive, despite some moderation from recent high levels
Future sales (balance of opinion): Over the next 12 months, is your firm's sales volume expected to increase at a greater, lesseror the same rate as over the past 12 months? Indicators of future sales (balance of opinion)*: Compared with 12 months ago, recent indicators (order books, advance bookings, sales inquiries, etc.) improved, deteriorated or remained the same?
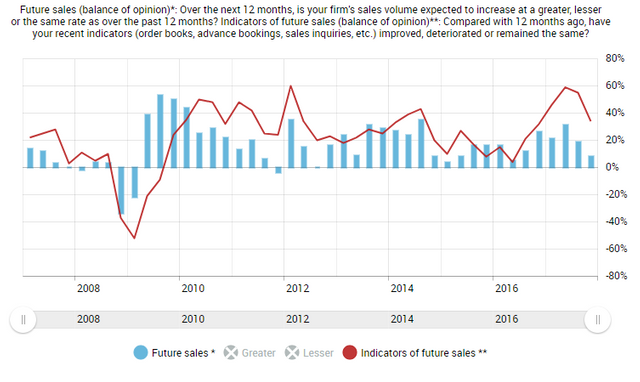
- Percentage of firms expecting faster growth minus the percentage expecting slower growth
** Percentage of firms reporting that indicators have improved minus the percentage reporting that indicators have deteriorated
Several firms also mentioned competition, particularly in the retail sector and related supply chain, and more restrictive regulation as issues dampening their sales outlook. Indicators of future sales have improved compared with 12 months ago (Chart 2, red line), although this view is less prevalent than in previous surveys, as the pickup in demand from domestic customers is losing steam.
On balance, firms expect an acceleration in export growth, backed by a further improvement in indicators of future sales from foreign customers. Moreover, views on the US economy have strengthened due to expectations of upcoming tax reforms and strong US consumer demand. While respondents are increasingly concerned about the renegotiation of the North American Free Trade Agreement and rising protectionism more generally, most see healthy US growth and the low Canadian dollar benefiting their sales over the next 12 months.
The indicator of investment intentions over the next 12 months bounced back to near-post-recession highs (Chart 3). Plans to increase investment are broad-based across all regions and sectors. Several respondents are seeing favorable demand conditions and higher capacity pressures, and are reporting plans to expand capacity in response. Others are investing as part of multi-year projects or to catch up from a period of low investment. Yet, some factors continue to weigh on firms’ plans: tax and regulatory hurdles are mentioned more often, and a few firms also cited uncertainties around US trade policy, among other factors.
Chart 3: The indicator of investment intentions rebounded, signalling broad-based positive investment intentions
Over the next 12 months, is your firm’s investment spending on M&E expected to be higher, lower or the same as over the past 12 months?
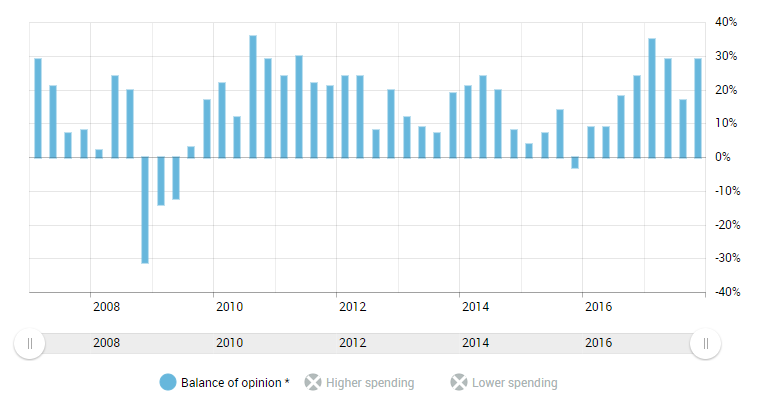
- Percentage of firms expecting higher investment minus the percentage expecting lower investment
The indicator of employment intentions moved up, reflecting widespread plans to increase hiring (Chart 4), particularly in the service sector. Given strong demand and more reports of labour-related capacity constraints, hiring intentions improved most in Central Canada. Meanwhile, plans to expand staff have softened in the Prairies, where firms cited underutilized labour or flat sales expectations. A number of firms also noted that automation and technology are reducing the need to increase employment.
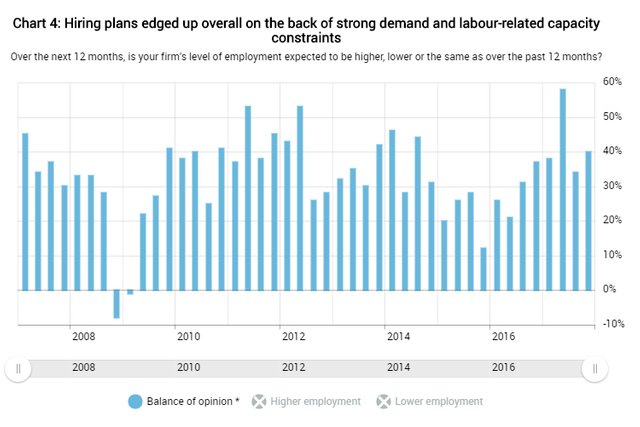
- Percentage of firms expecting higher levels of employment minus the percentage expecting lower levels
Pressures on Production Capacity
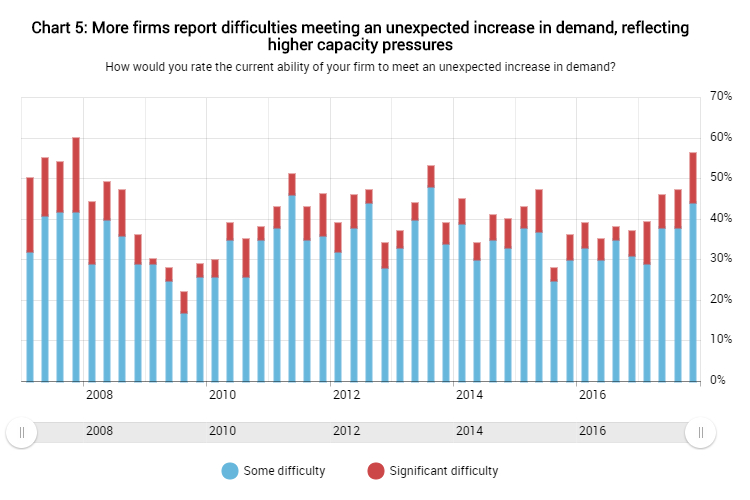
The share of firms reporting that they would have some or significant difficulty meeting an unanticipated increase in demand moved up again, to reach its highest level since the 2008–09 recession (Chart 5). Pressures on firms’ capacity are pervasive in British Columbia, but are also becoming more apparent in Central Canada, inducing several firms to bring in flexible capacity, including through subcontracting, outsourcing, immigration and automation. Results suggest that slack remains in the energy-producing regions.
Labour shortages are also becoming more common. The balance of opinion on labour shortage intensity continues to point to the general view among firms that shortages are more intense than they were a year ago (Chart 6, red line), although less so in the energy-producing regions. The number of firms judging that such shortages are limiting their ability to meet demand increased in this survey (Chart 6, blue bars). Shortages are most evident in occupations related to information technology, tourism and hospitality, and construction and real estate—areas that have seen strong demand.
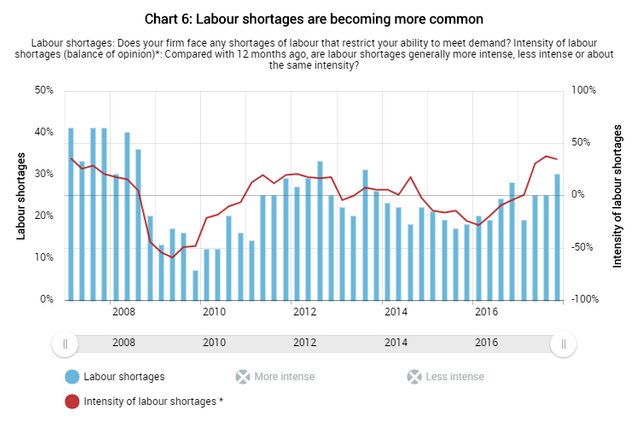
- Percentage of firms reporting more intense labour shortages minus the percentage reporting less intense shortages
Prices and Inflation
On balance, firms in most sectors expect an increase in the pace of input price growth (Chart 7). Firms’ expectations for rising input costs, particularly in the goods sector, commonly reflect the view that higher prices for commodities, from base metals to energy, are pushing up raw material costs. Overall, compared with previous surveys, firms no longer view the weaker domestic currency as further inflating the cost of their imports.
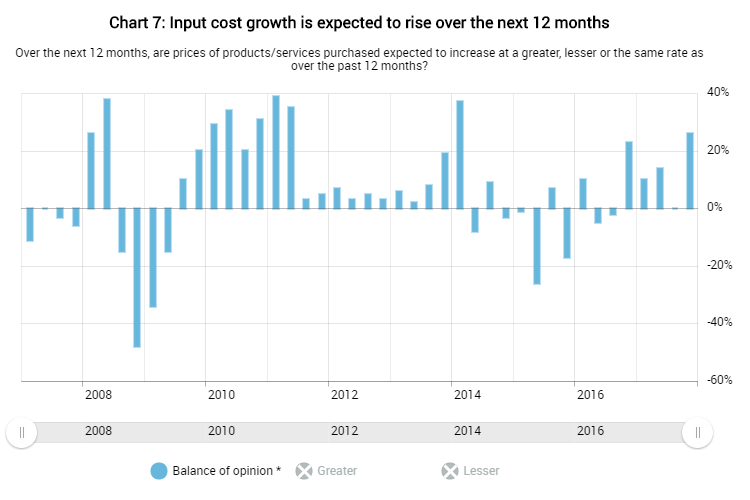
- Percentage of firms expecting greater price increases minus the percentage expecting lesser price increases
Despite the acceleration in input prices, firms anticipate no change in the pace of their sales price growth overall (Chart 8). Several respondents noted that increased competitive pressures are dampening their ability to raise output prices. A number of firms also referred to structural factors, including e-commerce and globalization, as influencing their pricing strategies. Rising labour costs (Box 1), often related to upcoming increases in the minimum wage in several provinces, as well as other non-labour input costs, continue to put upward pressure on output prices.
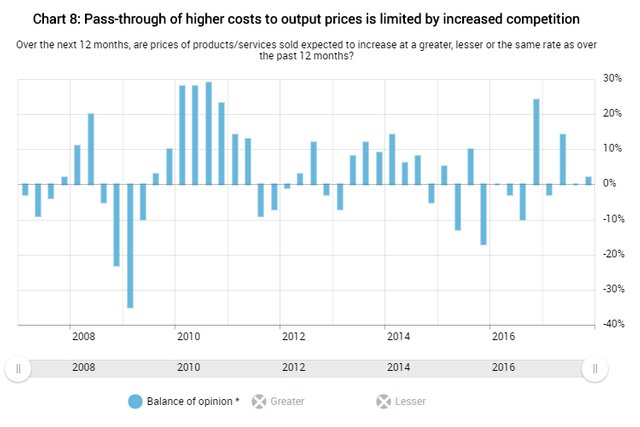
- Percentage of firms expecting greater price increases minus the percentage expecting lesser price increases
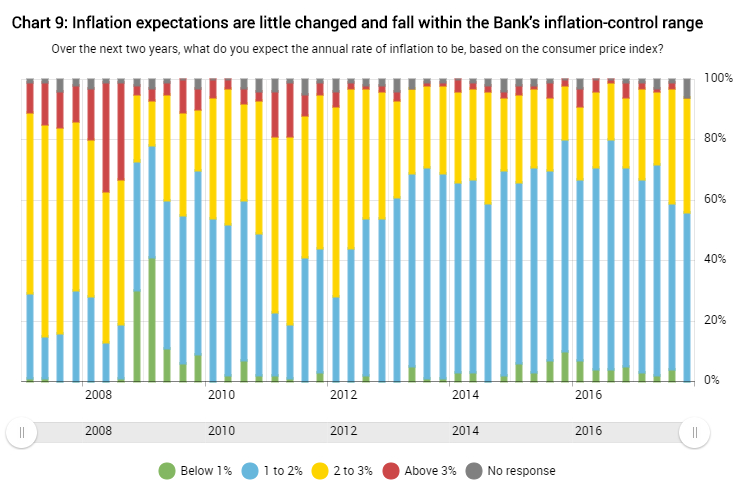
After moving up in the autumn survey, inflation expectations are largely unchanged (Chart 9). A slight majority of firms continue to see inflation hovering in the lower half of the Bank’s inflation-control range, with past inflation trends most frequently shaping their expectations. A number of the firms anticipating somewhat higher inflation cited rising labour costs, particularly minimum wage increases. Taken together, all responses to this survey fall within the Bank’s inflation-control range.
Credit Conditions
The balance of opinion on credit conditions, at just below zero, suggests that terms for obtaining financing remained largely unchanged over the past three months (Chart 10), apart from higher prime rates.1 Most firms across all sectors and regions reported no change in credit conditions, and the vast majority consider access to credit to be relatively easy. When asked about the impact of the Bank’s recent policy rate increases, some firms noted modestly higher borrowing costs, although these were not materially influencing their operations.
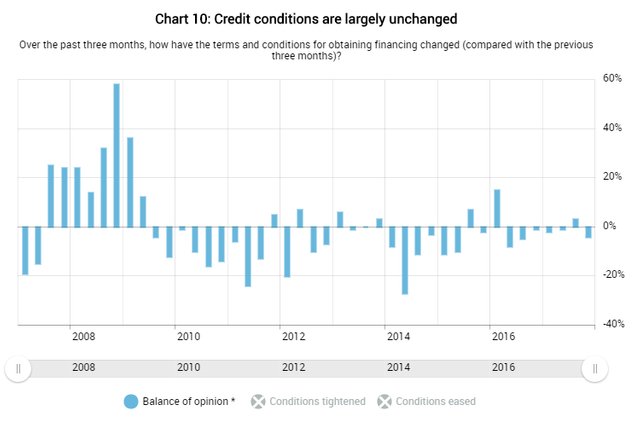
- Percentage of firms reporting tightened minus the percentage reporting eased. For this question, the balance of opinion excludes firms that responded “not applicable.”
Business Outlook Survey Indicator
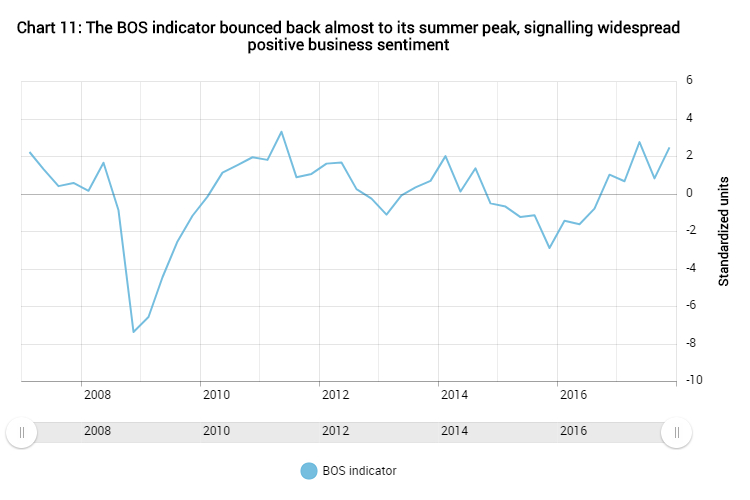
The Business Outlook Survey (BOS) indicator, which summarizes the main survey responses, has almost returned to its summer peak (Chart 11). In particular, strong expected input price growth and investment intentions pushed up the indicator, but responses to nearly all the BOS survey questions are holding above their historical averages and thus contributing positively. The result signals that positive business sentiment is widespread.
Box 1: Wage pressures are not yet widespread, but they are picking up due to minimum wage increases
There is a broadly held view among firms that capacity pressures have intensified over the past year and will continue to do so over the next 12 months. Labour-related capacity constraints are the most commonly cited reasons, followed by lack of physical capacity. However, in most regions, these pressures are not yet translating into generalized wage pressures.
Firms in the Business Outlook Survey are asked whether they expect increases in their labour costs (hourly wages) to be higher, lower or about the same over the next 12 months as they were in the previous 12 months. Although the balance of opinion on firms’ expectations for wage growth is an imprecise indicator of official wage statistics, the series shows a strong forward-looking correlation with growth in business sector employment (Chart 1-A). This could be because firms’ wage outlooks reflect their assessment of the current and expected strength in the general labour market. For example, if hiring conditions are tight, firms tend to expect they will need to offer higher wages to attract and retain workers. In this sense, firm‐level wage expectations capture information about broader employment conditions. Furthermore, previous Bank of Canada research has revealed that the market wage rate is indeed the most important factor used by Canadian firms when setting employees’ wages.2
Recent results show that pressures on wage growth have edged up and are widespread in British Columbia, where firms cited difficulty recruiting and retaining staff due to hiring competition as the key determinant, followed by minimum wage increases. In contrast, firms in Central Canada cited minimum wage increases as the principal driver of their wage growth expectations, followed by hiring competition. Firms in the energy-producing regions, where wage growth expectations are more modest, emphasize wage catch-up after a period of weakness.
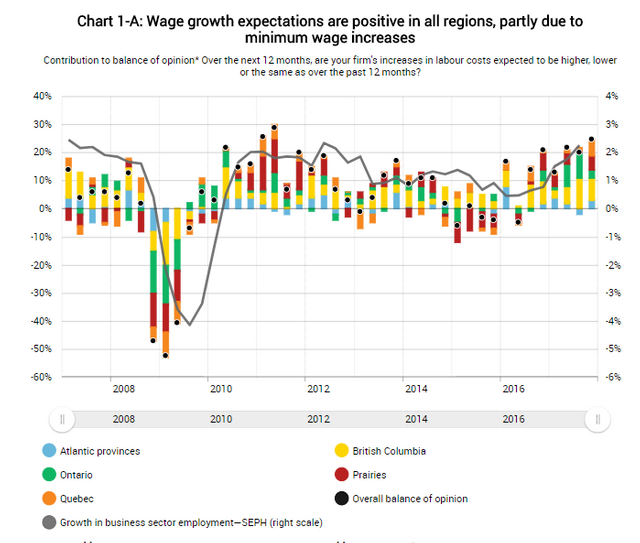
- Percentage of firms expecting higher wage growth minus percentage of firms expecting lower wage growth
Notes: SEPH stands for Survey of Employment, Payrolls and Hours. Growth is in year-over-year terms.
Regional results rely on a small sample size.
As in the Senior Loan Officer Survey, firms are asked about the cost of credit, expressed as spreads over base rates rather than as the level of rates. Thus, if borrowing costs increase by no more than the recent increase in the policy rate (meaning that the spread over the prime rate is unchanged), credit conditions as reported in the survey are unchanged. [←]
D. Amirault, P. Fenton and T. Laflèche, “Asking About Wages: Results from the Bank of Canada’s Wage Setting Survey of Canadian Companies,” Bank of Canada Staff Discussion Paper No. 2013-1 (February 2013). [←]
The Business Outlook Survey summarizes interviews conducted by the Bank’s regional offices with the senior management of about 100 firms selected in accordance with the composition of the gross domestic product of Canada’s business sector. This survey was conducted from November 14 to December 8, 2017. The balance of opinion can vary between +100 and -100. Percentages may not add to 100 because of rounding. Additional information on the survey and its content is available on the Bank of Canada’s website. The survey results summarize opinions expressed by the respondents and do not necessarily reflect the views of the Bank of Canada.
Content Type(s): Publications, Business Outlook Survey
(COLLECTED)
Hello @mohaimenol, upv0t3
This is a free service for new steemit users, to support them and motivate them to continue generating valuable content for the community.
<3 This is a heart, or an ice cream, you choose.
:)
R4ND0M:
1812 5115 6246 3954
8533 9306 6225 5319
3676 7377 3684 3121
5175 6711 4493 4812
Congratulations @mohaimenol! You received a personal award!
You can view your badges on your Steem Board and compare to others on the Steem Ranking
Vote for @Steemitboard as a witness to get one more award and increased upvotes!