WADDUP GREENLAND; HOW IS THE WEATHER DURING THIS GRAND SOLAR MINIMUM?
While all we heard about the weather in western mainstream media this past summer was about the heatwave and the drought that overtook Europe and parts of the US, which incidentally was a drought-driven heatwave. No moisture on the hardpacked ground increased solar forcing pushing temperatures upward. And while it was warmer than normal, few hot temperature records were actually broken. The real damage was done to crops and for the record, we have records of this sort of weather from the early 1800s, 1600s and even from the mid-1300s. What these periods all have in common is that they were Grand Solar Minimums. And according to recent paper published reconstructing Total Solar Irradiance(TSI) we are in a Grand Solar Minimum that will last at least until 2075 called the Eddy Minimum.
Yes, while the heat was on for Europe and NA, it was not so for Greenland which experienced a colder and snowier summer than usual, due to the meridional jet stream, as they were hit with a cold blast of Arctic air in August bringing with it snow which raised the accumulated levels for the Greenland Ice sheet well above the multidecadal average for another year in a row. The DMI calculated a total SMB of 517bn tonnes this year, which is almost 150bn tonnes above the 1981-2010 average, ranking just behind the 2016-17 season as sixth highest on record.

Yes, we heard little if anything of this from the mainstream media during the summer as it does not fit the narrative of the Warmist propaganda they seem to push, but now that the jet stream has moved in what is called the North Atlantic Oscillation(NAO) and is starting to bring cold temperatures and snow to NA and Europe, and warm temperatures up into Greenland, I expect there will be some typical warmist fear mongering about Greenland heating up, even though the temperatures will still be below or hovering around zero degrees. Meanwhile, according to DMI dataset, Greenland's ice cover is breaking records like last year as areas to the west and south-east gain accumulation.

Snow and ice accumulation in Greenland present date versus multi-decadal average
 Recreation of the Maunder Minimum climate showing NAO. Image courtesy of NOAA.gov

Image of present jet stream pattern looking much like Maunder Minimum climate recreation map. Image courtesy of Electroverse
They did it before during Feb of 2017, the mainstream media came alive with fake news stories of "tropical" weather in the Arctic and how the temperature went up by 45* C. What they neglected to say was that the temperature went from -51* C to -7* C and hardly constituted an adjective such as tropical or the false claims that the ice was melting.

Speaking of claims of melting ice. the mainstream media lately has been lamenting this large ice block as being "unusual". Ice calving, especially when involving such a large piece of ice is not indicative of melting ice, but is indicative of gowing ice which, based on the DMI data seems to be the case. As the ice grows it needs to go somewhere and the ocean is the likeliest of places and it can only add to the accumulating Arctic Ice.

These cold summer temperatures for Greenland explain the buildup of four-plus meters of ice along Greenland's north coast and throughout the Queen Elizabeth Islands north of Canada. While generally year over year there is an increase of a meter in ice thickness, the extent has shifted filling the Canadian side of the Arctic, while the Russian side saw a decrease. But now that the NAO has shifted we see the growth of ice beginning north of Siberia.
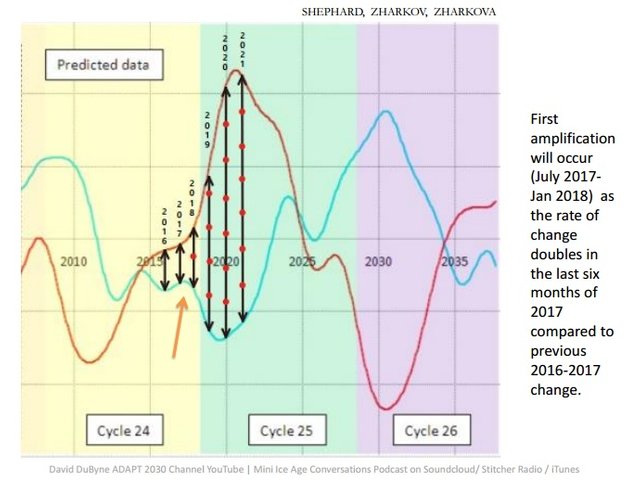
Meanwhile in Great Britain, as I have been predicting all year, they are experiencing what is being called the "COLDEST OCTOBER DAYS IN A DECADE AS ALL FOUR UK NATIONS RECORD HEAVY SNOW" It is my expectation, based on Zharkova et al double-dynamo model of the sun that Great Britain will have a colder and snowier winter than last year when they suffered from what was called "The Beast from the East".

Double-dynamo model. As the waves move further out of phase, less and less energy will be transferred to the earth. Notice the difference between last year and this year as that will define how much worse this winter will be.
I will also go out on a limb and predict that next summer they will experience another drought-driven heat wave, all due to a Grand Solar Minimum.
Thank you for reading. If you would like to see more posts like these then please follow me. Leave an intelligent question or an interesting comment and I shall follow you. Lets get a conversation statrted.
Written by Freddie Thornton
@daemon-nice
PEACE

