From the Sun to the Earth; A Weather report for the Grand Solar Minimum by Frederick Thornton
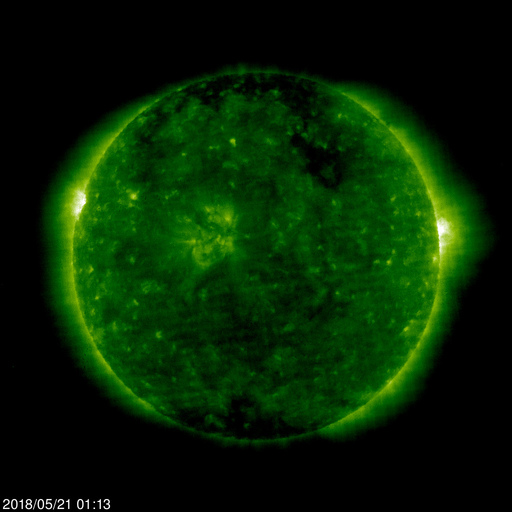
Image courtesy of SOHO. The sun viewed at 195 angstroms
Another day of the quiet sun with no solar flares or sunspot activity. Though a small coronal mass ejection did occur off the south west limb which will miss earth entirely.
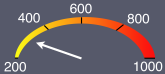
Image courtesy of SOHO.
Solar Wind Speed is moderate at 287 km/sec.
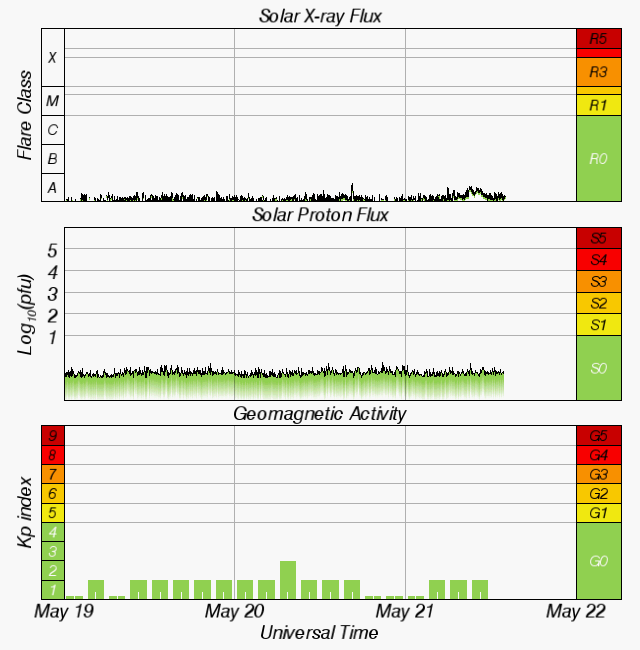
Image courtesy of NOAA
Solar x-ray flux shows a minute uptick then calms down, likely due to the small cme mentioned earlier that will miss earth.
Solar proton flux is quiet and steady.
Geomagnetic Activity reveals a low KP index, indicating earth's shields to cosmic rays is weak creating a potential threat to health(see chart below) and especially to anyone flying over the north pole. The low KP index of "0" may also be having an effect on volcanic activity. See below.
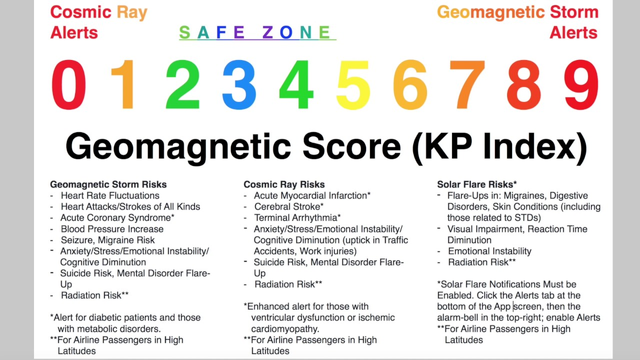
Image courtesy of SuspiciousObservors
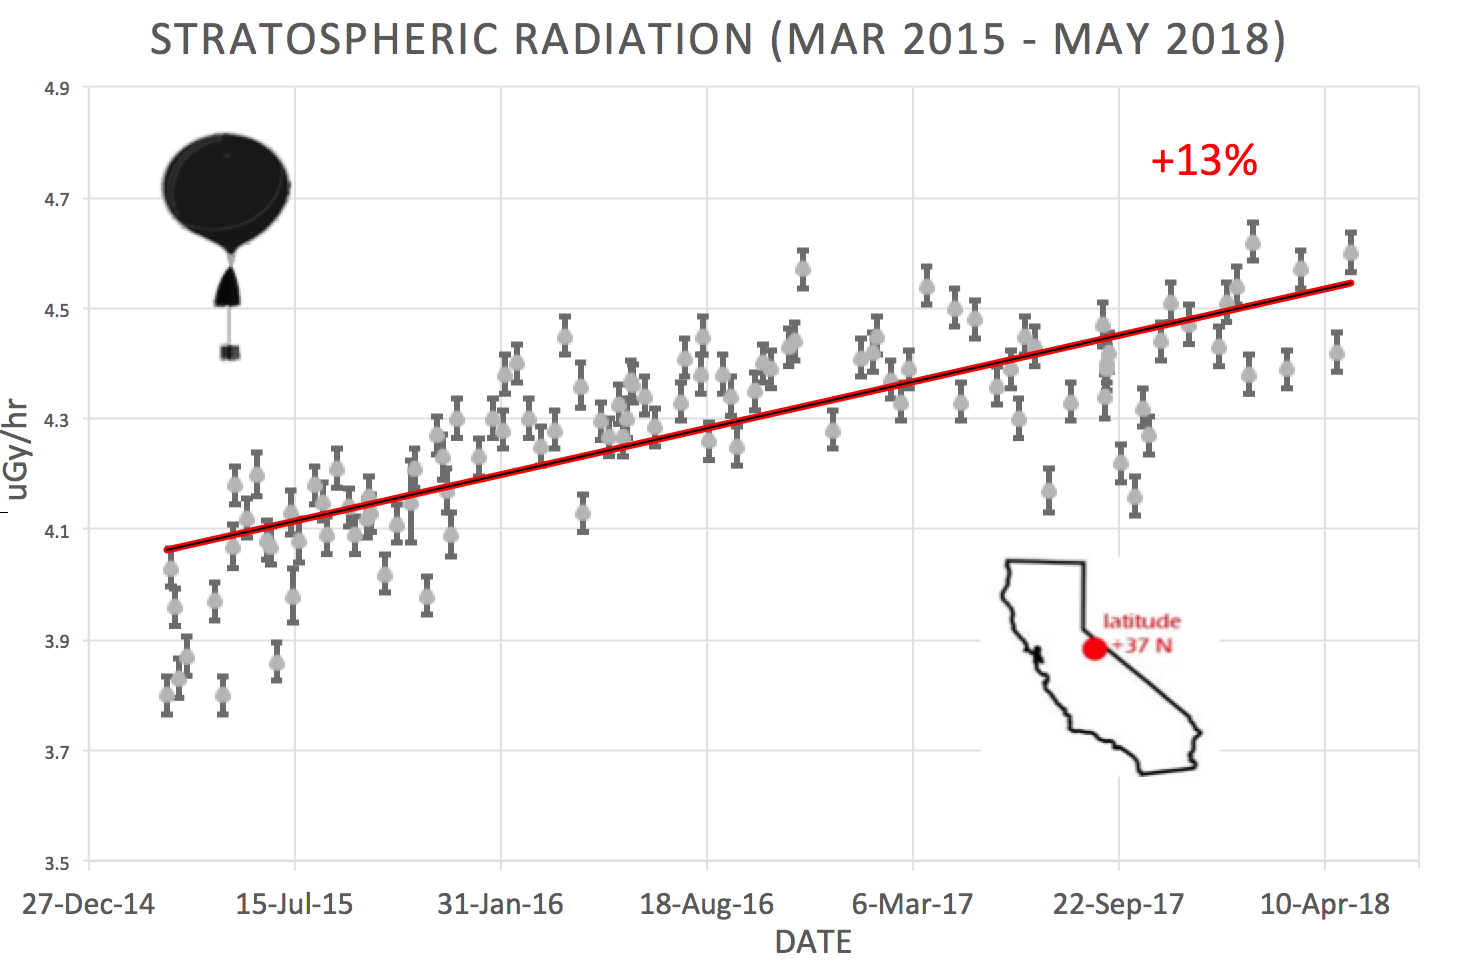
Image courtesy of spaceweather.com and Dr. Tony Phillips
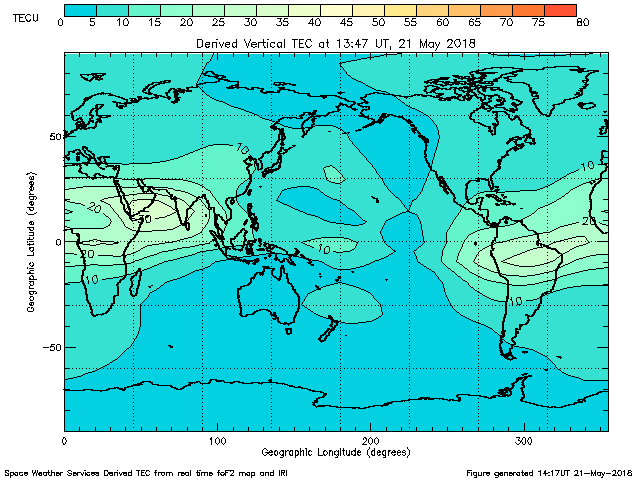
Image courtesy of Australian Bureau of Meteorology
TEC or Total Electron Count is highest along the Equatorial Electrojet as it should be but is otherwise quiet.
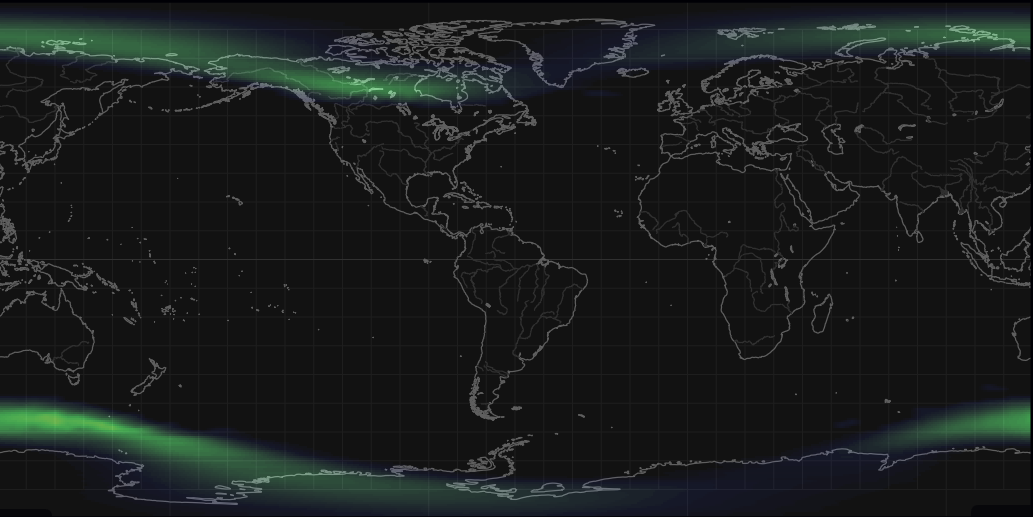
Image courtesy of nullschool.net
Auroral Activity is light to moderate as is expected with a low KP index of "0".
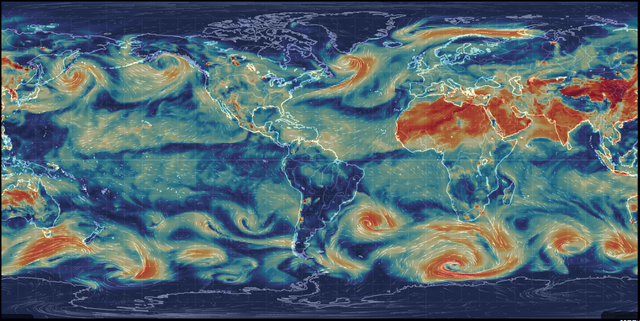
Image courtesy of nullschool.net
Atmospheric Particulates at <10mcg is very high over China and the Caucasus region. Take note of the particulate coming off of the southern tip of Japan and is swirling over to the west coast of North America in a pair of spirals. This may be attributable to recent eruptions at Sakurajima.
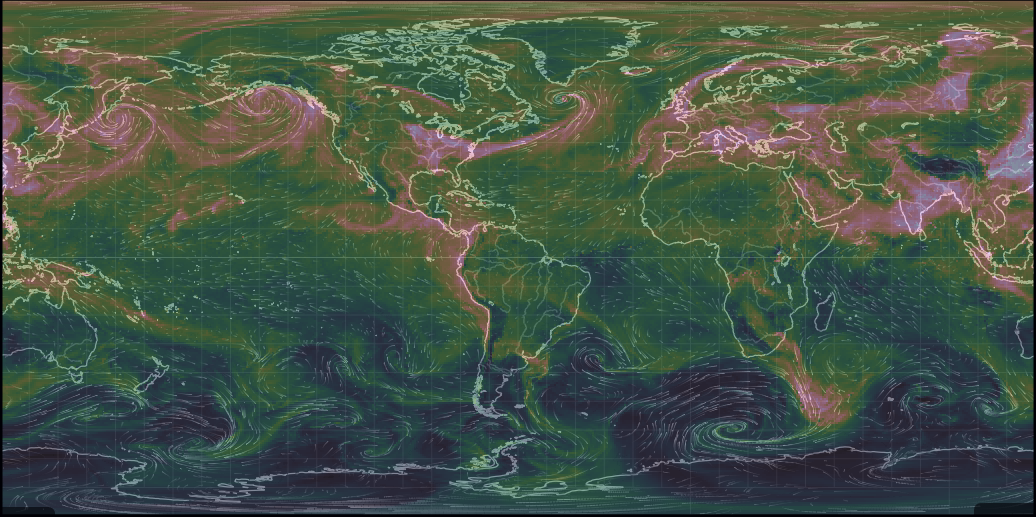
Image courtesy of nullschool.net
Sulfate(SO4) levels high in northern China, India and the north eastern United States and is following similar patterns as the atmospheric particulates.
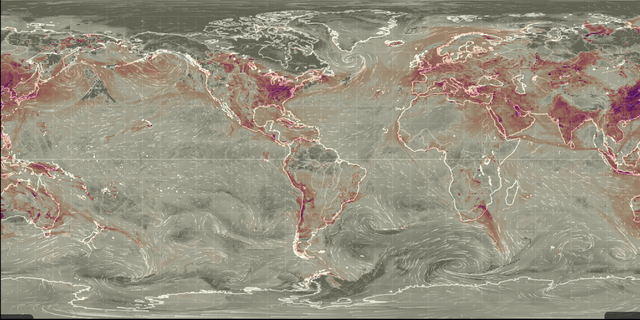
Image courtesy of nullschool.net
Sulfur dioxide Surface Mass is highest over industrialized and populated areas and follows similar patterns as did atmospheric particulates. Also note it is high over the active volcanic regions. Not much change over the last few days.
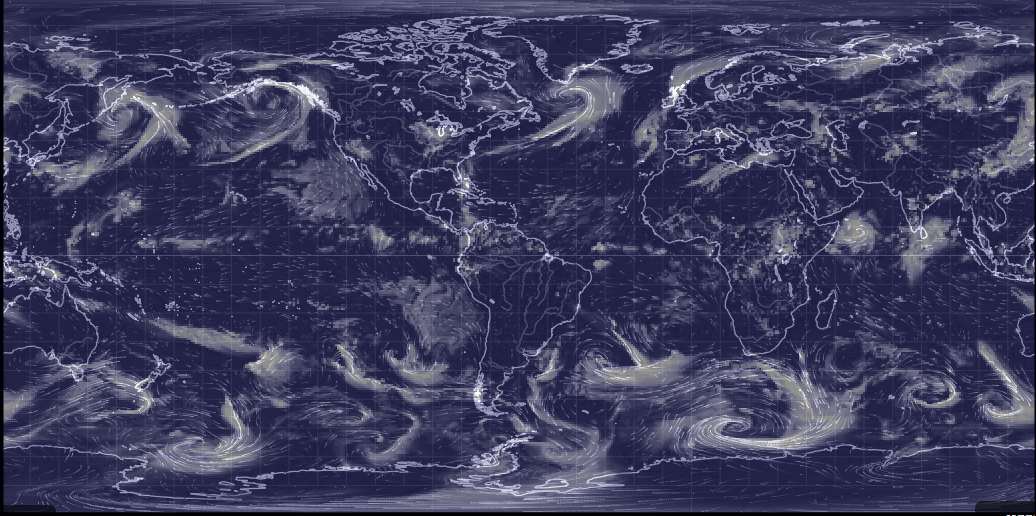
Image courtesy of nullschool.net
Total Cloud Water reveals a strong correlation with particulate map especially in jet stream regions. This is likely due to rain nucleation via cosmic rays utilizing particulate as a base.
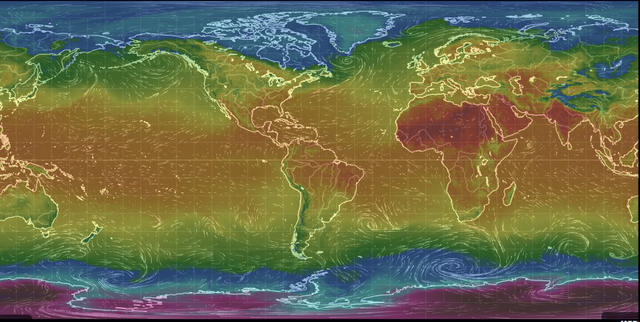
Image courtesy of nullschool.net
Temperature map reveals warmest regions in North Africa, Mid-east and India with temperatures ranging between 40* C ~ 45* C (+/-).
Arctic temperature at geographic north pole is a balmy -0.2* C.
Antarctic temperature at geographic south pole is a chilly -43.8* C. Temperatures around the Antarctic Peninsula may reach 1* C at its tip.
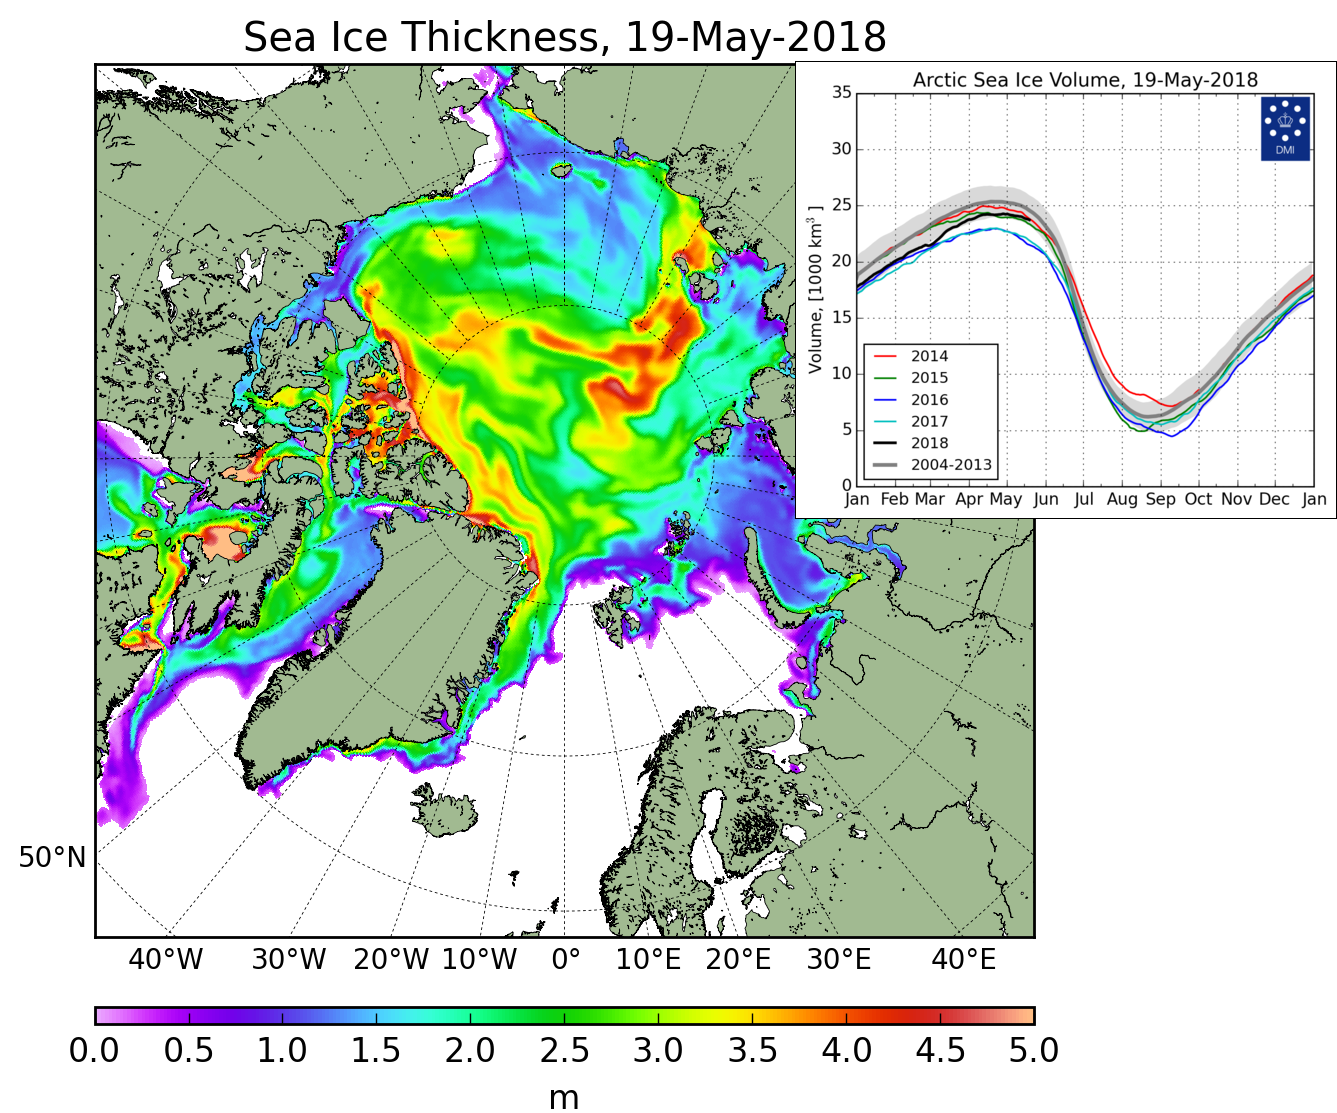
Image courtesy of Danish Meteorological Institute
Sea Ice Thickness and Volume are doing quite well with most of the north covered in ice 2.5 meters and thicker. Sea Ice Volume is well within multidecadal average and has eclipsed 2014 levels.
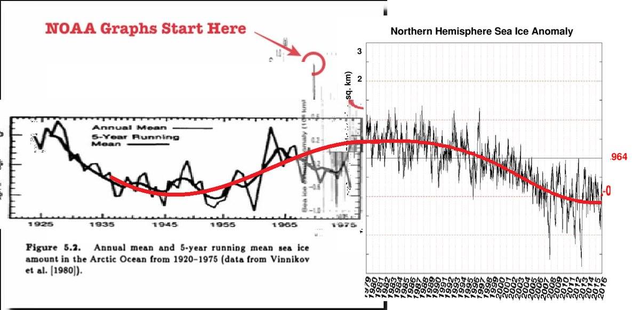
Image courtesy of newscats
Eighty year sea ice averages reveal a sine wave of growth and shrinkage.
"Sea ice habitat for polar bears has not become progressively worse each year during their season of critical feeding and mating, as some scaremongers often imply. It’s true that absolute extent of Arctic ice is lower this spring than it was in 1979. However, according to NSIDC Masie figures, polar bear habitat at mid-May registers about 12 million km2, just as it did in 2006 (although it is distributed a little differently); other data show spring extent has changed little since a major decline occurred in 1989, despite ever-rising CO2 levels."....Full article linked here
Has the north pole ice caps returned to 1979 levels?
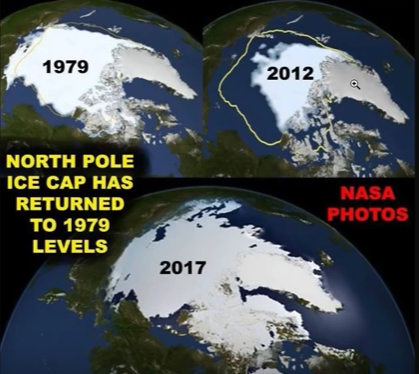
Image courtesy of Oppenheimer Ranch
You decide.
USA TODAY headline from May 17 2018-
"Earth just had its 400th straight warmer-than-average month thanks to global warming"
This is a misrepresentation of the truth meant to distract you from the egregiously cold weather of the last two winters where 6000+ cold temperature records were broken globally. Let's look at a graph for comparison.
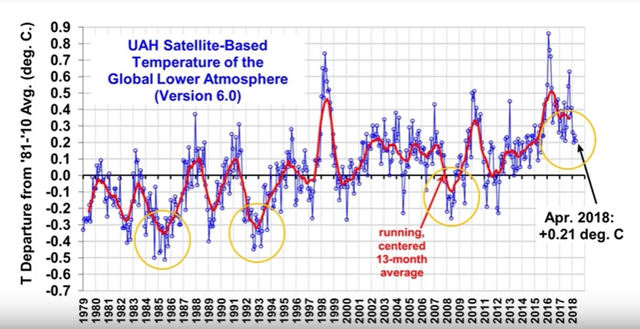
Image courtesy of Adapt2030
Why did they choose 1985? Because 1985 is the lowest point on the graph. And while one can say that overall the averages are up, what they avoid is the decline in global mean temperatures of the last two years. A decline of 0.56* C that offsets more than half of the global warming of the last century. And of note that while global mean temperatures did drop by 0.56* C, CO2 continued to increase and is now at over 412 ppm. CO2 increased while temperatures dropped.
It is articles like this that suggest there is some sort of conspiracy to keep you from the truth about Earth's constantly changing climate.
IN THE LAST TWO YEARS GLOBAL MEAN TEMPERATURES DROPPED WHILE CO2 LEVELS INCREASED
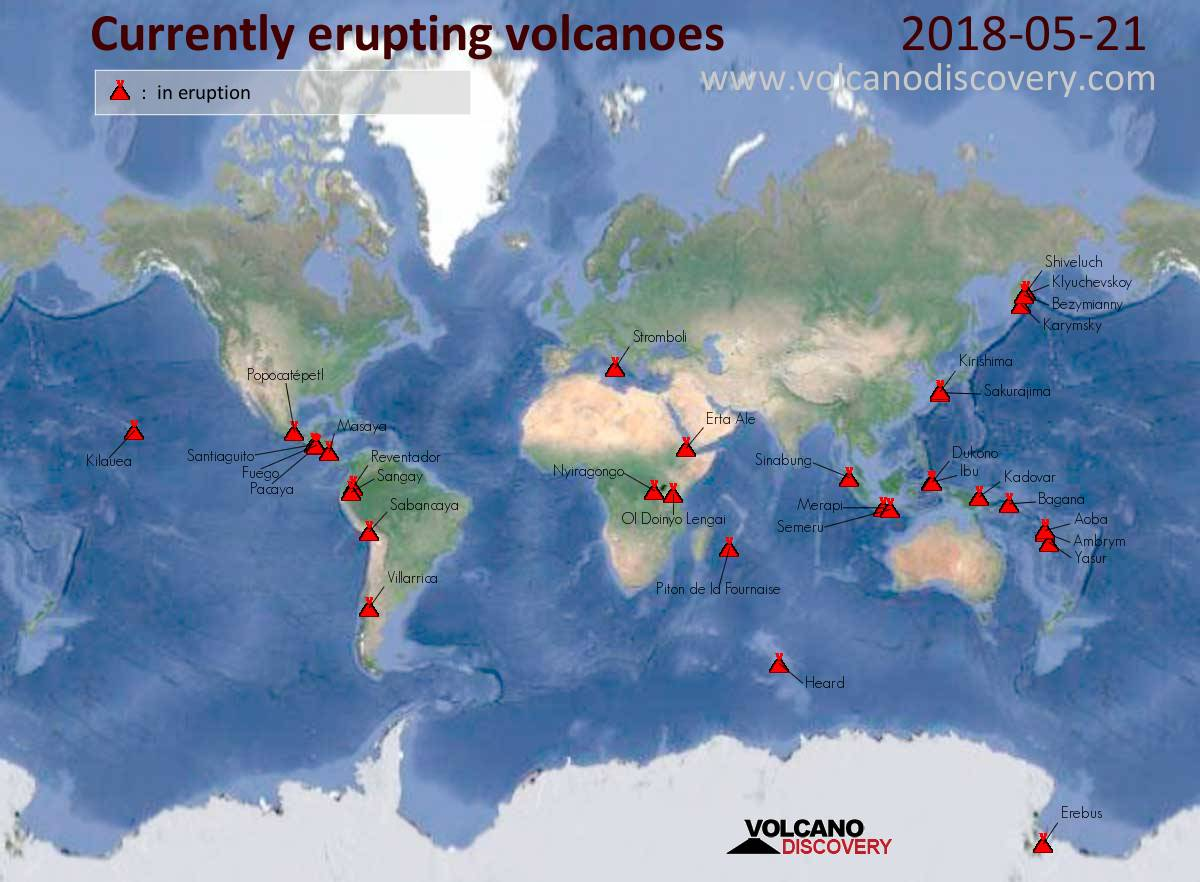
image courtesy of VolcanoDiscovery
Erupting Volcanoes in the news. Sakurajima erupted explosively twice again on May 19 & 20 making it the 40th time in 50 days. Sabancaya is producing intermittent puffs of volcanic ash. Merapi erupted again causing an Aviation Code of Orange sending a plume 1200 meters above summit(2968m) to the stratosphere.
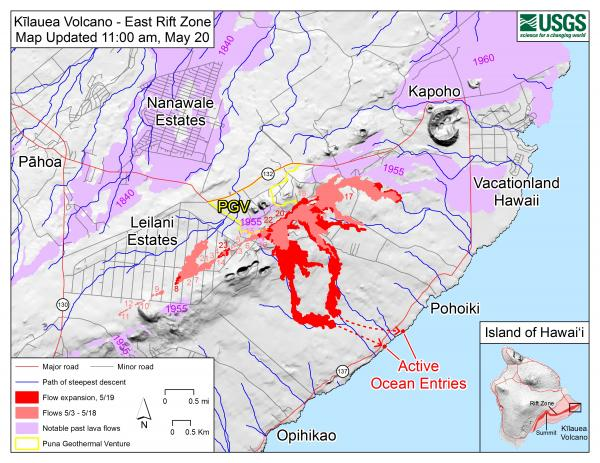
image courtesy of VolcanoDiscovery
Kilauea lava flows have changed from a thick viscous slow moving lava to be more like rivers of lava flowing much faster. The lava has reached the ocean and is now producing a new threat to locals in the form of "laze"- which is a mashup of lava and haze and consists of sulfuric acid and tiny glass particles. This is highly toxic and can be deadly and will cause lung, eye and skin irritation.
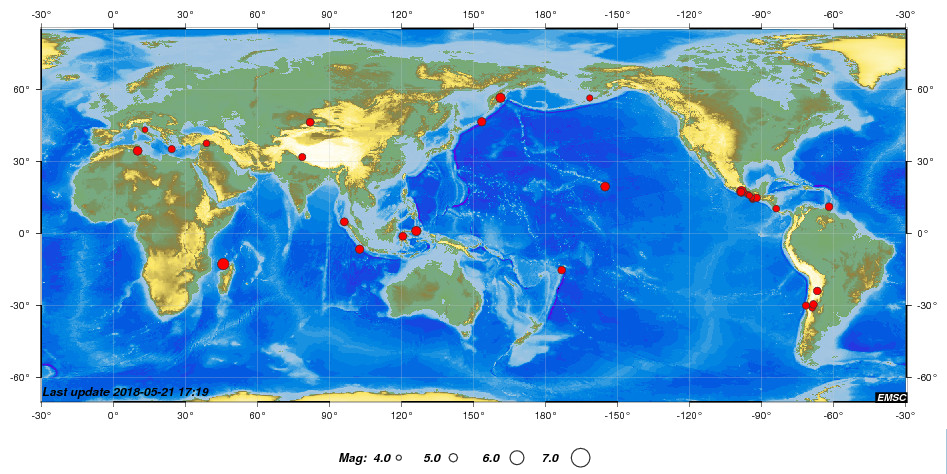
*Image courtesy of European-Mediterranean Seismological Centre
Thirty earthquakes with a magnitude of 3.0+ in the last 24 hours with a 5.5 in the Mayotte region, a 5.2 in Guerrero Mexico, a 5.0 east of Kamchatka and another 5.0 in the Molucca Sea. Kilauea is still experiencing swarms of rumbles mostly below a magnitude of 4.
Other news for the Grand Solar Minimum involves an ebola pandemic threat in the densely populated city of Mbandaka in the Democratic Republic of Congo with a population of over a million. With eleven case now confirmed many are saying that this is a major game changer. Reuters reports that authorities have started a vaccination campaign utilizing an experimental vaccine, of which I am highly suspicious of as it essentially uses the Congolese citizens as experimental test subjects with no guarantee of its effectiveness. Also to note with experimental vaccines is the potential for spreading the disease as has occurred with other vaccines that actually caused outbreaks of the disease they were trying to prevent. As the sick and those exposed are being quarantined, the World Health Organization has convened a meeting for Friday to discuss the potential threat to other countries.
I hope you got something out of this post.
Thank you for taking the time to read it. If you would like to see more like this then please feel free to follow. Leave and interesting question of=r comment and I shall follow you.
Compiled and written by F. Thornton
PEACE
@daemon-nice