Understanding the Real Differences Between OCPU & vCPU

Why the arrival of Oracle Cloud Infrastructure is a big deal
Published by Cintra in CLOUD, ORACLE on December 13th, 2017
There have been some big announcements around the Oracle Cloud recently, not least the availability of a new European region in Frankfurt. We’re really excited about this, because it expands Oracle’s second-generation of cloud infrastructure (known as Oracle Cloud Infrastructure, or OCI) beyond North America for the first time. A London-based OCI region is due to open in early 2018.
What’s more, the recent improvements to OCI have made it an even more compelling proposition, unlocking the door to new use cases for the cloud in your business.
Let’s briefly recap on the key enhancements to the Oracle Cloud, focusing primarily on the OCI Infrastructure as a Service offering. We’ll then look at what the new European OCI facility could mean for your organization.
Better performance and other IaaS improvements
Firstly, performance has been beefed up significantly, thanks to the new X7 processors, based on Intel’s latest Skylake chips. Pleasingly for customers, the price per core of the X7 remains the same as the previous-generation X5.
(While we’re on the topic of CPUs, incidentally, my colleague Justin Bennett has put together a blog on the differences between Oracle’s OCPU measure and the vCPU metric used by most other cloud providers. It’s a key difference you need to understand if you’re comparing cloud platforms.)
Back to OCI improvements, and there’s now also the option of using one of NVIDIA’s Pascal-generation GPUs, to deliver high performance for those really demanding workloads (think artificial intelligence and the like). Again, these offer a very good price-to-performance ratio, if you need them.
Other key OCI IaaS improvements include:
The ability to run Oracle Database and Real Application Clusters (RAC) on virtual machines in the Oracle Cloud
Two-node RAC for Oracle Database, available in the Frankfurt and Phoenix regions
Enhancements to Block Volume storage, boosting volume sizes to 16TB
Support for a new version of Ravello, boosting performance and scalability for VMware- and KVM-based apps on Oracle Cloud Infrastructure
Launch of Cloud Infrastructure Archive Storage, a low-cost tier for data you need to keep, but don’t require fast or frequent access to new 25Gb network capability
Launch of the Data Transfer Appliance, which will enable you to shift large amounts of data from your on-premises data center to Oracle Cloud Object Storage, without sending it over the internet
Launch of OCI DNS (aiming to improve the user experiences of online apps), Oracle Cloud Infrastructure Email Delivery, Cloud Infrastructure Tagging and the Managed Cloud-Native Development Service
High-availability, without the high cost
The other big benefit of having OCI available in Europe is around availability and resilience. Where Oracle’s Classic cloud data centers were individual facilities, the OCI centers have three so-called ‘availability domains’. This means the facility is made up of three physically separate locations, linked by very fast networking. Consequently, you can replicate your data across more than one location for disaster recovery purposes, without needing to pay for third-party network provision between them, as you would previously have needed to if you required a guaranteed high level of performance.
It means you can create extremely reliable and highly available systems in the Oracle Cloud in an affordable way.
In summary
The arrival (and soon to be expansion) of Oracle Cloud Infrastructure in Europe is big news for any organization that has wanted access to high-performance cloud for their Oracle workloads, but can’t have its data in North America.
The region in Frankfurt means you can now architect extremely fast, reliable and highly available platforms for your business-critical Oracle Databases and the applications that use them.
Tags:cloud, iaas
Share on Facebook Share on Twitter Share on Reddit Share on LinkedIn Comments Off on Why the arrival of Oracle Cloud Infrastructure is a big deal
Understanding the Real Differences Between OCPU & vCPU
Published by admin in CLOUD on November 2nd, 2017
Architecting comparable IaaS workloads across Oracle, AWS, Azure & Google
In arranging cost comparisons for customers across multiple cloud vendors, it became apparent that there are differences in the most core metric of all – processing power – that not all customers may be aware of. These differences when factored in with costs can make the already very good Oracle Cloud offering seem an even more powerful proposition.
Oracle measures compute in OCPUs whilst Amazon AWS, Microsoft Azure and Google Cloud all use vCPUs – but the 2 measures cannot be directly aligned as they are very different.
Let’s get right to the conclusions before we get into the detailed rational below.
Real cores vs virtual CPUs
Developers benefit from real CPU core resources in the Oracle cloud
Workload Comparison
This means we can directly compare on-premises workload to the Oracle cloud
Value
The value the investment in each the Oracle cloud instance is 100% realized.
Overall Cost
Oracle’s cloud delivers this enterprise workload capability at a lower cost
vCPUs: AWS, Azure, Google Cloud3
AWS, Azure and GC vCPUs are charged at the Thread level, so a standard Intel processor core with Hyperthreading enabled has 2 Threads. Each Thread is then shared by VMs. Customers will be able to pay more for dedicated Cores, but these are not the norm.
OCPUs: Oracle Cloud Infrastructure (OCI)
3
Oracle OCPUs are charged at the Core level, with no sharing of compute resources! So, customers buying a single OCPU get a dedicated core with 2 Threads.
The dedicated Cores/Threads ensures guaranteed performance for workloads with no contention.
Thread Contention
Going beyond just thread comparisons, even the simple view of 2 vCPU = 1 OCPU cannot be made due to thread contention, whereby other resources are using those threads. This can have considerable impact on hosting multi-threaded applications that scale to serve multiple users. Developers and architects cannot directly compare on-premise hardware to cloud hosted vCPUs.
The exact factor of vCPUs to OCPUs, to provide the same amount of processing power is subject to the amount of overloading on the vCPUs at any point in time. But it will almost always be greater than 2:1.
The only resolution is to over-purchase / flex onto a larger number of vCPUs with associated costs until workloads are met, or to leverage known, dedicated OCPUs to have guaranteed performance/pricing.3
Price Comparison
The following comparison was created using public list prices from Oct 2017.
Vendor CPU Cores Mem Storage Utilization Monthly Cost Shape
Oracle OCI Frankfurt 2 OCPU / 2 Cores / Dedicated 14GB 400GB 100% $131.00
VM.Standard1.2 on BMC
AWS Frankfurt 4 vCPU / 2 Cores / Oversubscribed 16GB 400GB 100% $202.15 t2.xlarge linux
Azure Germany Central (Frankfurt)
4 vCPU / 2 Cores / Oversubscribed 14GB 512GB 100% $217.72 D3 v2
In this case, the shapes are driven by memory needs along with minimum core count. The Oracle shape provides 2 cores/4 threads with no contention at a lower price than AWS & Azure’s 2 cores/4 threads with contention.
Linux was used to avoid any differences in Windows licensing models.
Conclusion
The primary conclusion is to ensure your measurements for compute and other key performance metrics are balanced and allow a proper cost/performance assessment across cloud vendors.
Oracle has come from the high-end enterprise down, with a starting focus on massive workloads, guaranteed performance and stability. This engineering led viewpoint has driven its expansion into cloud from the Gen1 through to the Gen2 Bare Metal Cloud, now known as OCI. The focus is on engineering quality for the enterprise.
By comparison, AWS and Azure have come from the lowest commodity scale point of view and are slowly moving up. This is a key factor when planning the migration of enterprise workloads from on-premises to the cloud.
Share on Facebook Share on Twitter Share on Reddit Share on LinkedIn Comments Off on Understanding the Real Differences Between OCPU & vCPU
Oracle 12c RAC: New Features
Published by Cintra DBA team in ORACLE, RAC & CRS on August 4th, 2017
With Oracle 12c now established in most organizations as the standard, we wanted to highlight a few of the lesser-known features of 12c Real Application Clusters:
Oracle Flex Cluster:
Oracle introduced the Flex cluster feature with the 12c release, which uses a Hub and Leaf architecture. A Hub node is like standard Grid infrastructure nodes where the storage is mounted and it has direct access to Oracle Cluster Registry and Voting Disk. Leaf nodes are part of the cluster where storage is not mounted, but they are connected via Interconnect. (more…)
Tags:12c RAC, asm disk scrubbing, flex ASM, flex cluster, flex clusters, mixed mode, new features, oracle 12c, pure 12c mode, RAC, real application clusters
Share on Facebook Share on Twitter Share on Reddit Share on LinkedIn Comments Off on Oracle 12c RAC: New Features
GoldenGate Studio – Finally a GUI for data mapping
Published by Cintra DBA team in GOLDEN GATE, ORACLE on August 3rd, 2017
With introduction of GoldenGate Studio, replication solution can be pre-configured and deployment templates can be created by dragging and dropping data services and replication paths to the solution diagram.
Prior to GoldenGate studio, for data mapping we need to create mapping configuration manually for schema, tables and column mapping by analyzing respective schema and tables. By using GoldenGate Studio all of this can be achieved by GUI and deployment templates and profiles can be created to redeploy same solutions across different projects. (more…)
Tags:automation, gg, gg studio, golden gate, goldengate, ogg, ogg studio, oracle golden gate, oracle goldengate, studio
Share on Facebook Share on Twitter Share on Reddit Share on LinkedIn Comments Off on GoldenGate Studio – Finally a GUI for data mapping
Got an Oracle-based app running slowly? Here’s your guide to effectively diagnosing it
Published by Cintra in ARCHITECTURE, DATABASE, DESIGN, Hot Topics, ORACLE on August 2nd, 2017
We’ve all experienced that frustrating wait while a web page loads or a business application takes an age to process something. Poor user experiences cost your organization money and risk damaging its reputation. And with so many companies now using customer experience as a differentiator, any that lag behind are at a serious disadvantage.
But how do you go about addressing this type of slow performance? Enterprise applications can be incredibly complex, relying on a variety of servers, storage, networking infrastructure, databases and potentially other applications and services.
Identifying what exactly is causing the slow application performance can be exceptionally challenging. The monitoring tools used by your administration teams will probably give you little of value, because they focus on the big picture, rather than the details. Equally, it’s not uncommon for each team to be able to ‘prove’ it isn’t their cog slowing down the machine.
The four key questions of performance enhancement
The secret to successfully diagnosing and tackling performance issues with applications running on Oracle databases is to answer four key questions. Let’s look at each in turn and why it’s significant.
How long is the slow process taking?
There are really two parts to this question: what exactly is taking too long, and how long is it taking?
Is a particular screen or web page slow to load? Is it a specific batch process? Or does the whole application feel slow? If it’s the whole app, think about which element of it would deliver the greatest benefit if you could resolve it. This is where you should start your investigation – you can come back to other elements later.
Having defined what you’re aiming to speed up, you need to know how long it’s taking now – in simple, straightforward minutes and seconds. This ensures total focus on the actual user experience.
At this stage, it’s also helpful to identify any specific requirements you have around how long the process should take. Do you have a customer SLA that means it needs to complete within three seconds 99.9% of the time? Or did it used to take 10 minutes and now takes an hour? Be careful not to over-commit at this stage, because you don’t yet know what’s possible or practical – that understanding will come out of the next steps.
Why is it taking so long?
Having defined exactly what you’re looking at, you need to ascertain why your application is taking the time it is. As we’ve touched on, standard monitoring tools look at what the system as a whole is doing, not the individual application. So while a systems-level tool may show the CPU is running at 100% capacity, this doesn’t necessarily mean the CPU is your program’s bottleneck. System-wide statistics can throw you off the scent.
You need a different approach that enables you to pinpoint exactly how your application is spending your time, from the moment you start the process in question to the moment it concludes. This is what Cintra’s Method R approach does.
What if…?
Having identified what your application is doing, the next step is to identify one or more remedial actions that are likely to help accelerate the process. This will require a good understanding of how Oracle works.
Next, ask yourself ‘what if’ you make each of the changes. Quantify which will give you the greatest net benefit. This enables you to target your remedial actions to have maximum impact and avoid costly trial-and-error.
How straightforward this question is to answer will depend on the nature of the change: it can be relatively easy to know how much time you’ll save if you can eliminate 99% of the calls to a given subroutine, for example. But if you’re looking at more complex alterations, such as a database upgrade, or wholesale replatforming, you’ll need to do more work to model and/or measure what the likely performance improvement will be (and also whether there could be any side-effects). This work is where your team or your performance partner will really prove their worth.
Once you’ve identified that what you’re proposing will deliver the improvements you need, it’s time to roll out the change. And because of the scientific, data-driven approach you’ve followed so far, you’ll be highly confident that it will deliver the enhanced performance you’ve forecast.
What else?
With your most pressing need taken care of, you may now want to go back and look at other areas where your business would benefit from improved performance. This may be another element of the process you’ve been addressing so far. It may also be another part of the same application, or another app running on an Oracle database.
In this way, you can quickly and methodically tackle performance issues that are currently hampering your organization’s ability to offer the customer experiences you aspire to.
Why you need specialist tools to answer these questions
These questions in themselves are common-sense. The difficultly many organizations have is that they don’t have the tools to answer them. The normal Oracle tools don’t collect the right data, and even if DBAs or application developers were to gather it in another way, understanding and analyzing it can be challenging.
This is where the Cintra Method R tools are truly revolutionary, because they make it easy to answer these four questions. They are your proven, fast-track route to better performance and user experiences.
So with customer experience already a key differentiator in many sectors, you need to act now to ensure your Oracle-based enterprise systems are delivering the best-possible performance. Cintra’s Method R approach, using laser-focused response-time data, has a track record of delivering results fast.
Tags:database performance, MethodR, Oracle Ace Director, oracle performance monitoring, Performance, User Experience, UX
Share on Facebook Share on Twitter Share on Reddit Share on LinkedIn Comments Off on Got an Oracle-based app running slowly? Here’s your guide to effectively diagnosing it
Oracle Audit Vault: A Primer
Published by Cintra DBA team in SECURITY on June 26th, 2017
So, what is Audit Vault?
Audit Vault is one part of Oracle AVDF (Audit Vault & Database Firewall). It consolidates and secures audit event data from one or more Oracle or non-Oracle sources, and provides extensive and customizable reporting abilities to fulfil an organizations security and compliance requirements.
What is the architecture of Audit Vault?
Audit Vault is distributed as a software appliance and can be deployed on a standalone server or a virtual machine. It is comprised of the following two components.
Audit Vault Server
Central repository that stores audit data from one or more sources (secured targets)
Encrypted data using TDE (Transparent Database Encryption)
Provides a web interface to accomplish these tasks among others
Configure Secured Targets
Configure Audit Trails
Configure data retention policies
Set up high availability
Configure external storage
Set up access control
blog_av1
blog_av2
Audit Vault Agent
Deployed one per host, usually where the audit data is generated but can also be installed remotely
Retrieves audit data from various secured targets and sends it to the AV Server
Secured Targets can be Oracle or non-Oracle databases, operating systems or file systems
blog_av3
Can Audit Vault be configured in a high availability architecture?
Audit Vault can be configured in a high availability architecture. It is configured from within the AV GIU; however, standard Data Guard is configured in the background, including the Data Guard Broker. Any attempt to connect to the secondary AV server is automatically re-routed to the primary. Switchover or failover is managed from with the AV GUI.
How can I manage the amount of data held within Audit Vault?
Data in Audit Vault can be archived as part of your company’s retention policy. This is accomplished by creating an archive location and a retention policy. Retention times are based on the time that the audit event happened in the secured target. Currently, archiving has to be started manually but this is easily done via the AV GUI.
Data from the archive area can’t be reported on; however, archive data can be restored online via the AV GUI.
What can you do with the data in Audit Vault?
As an Audit Vault Auditor, you can run reports to examine data across various secured targets as well as Database Firewall if that has also been deployed.
The reports are organized into different categories, for example activity reports or compliance reports. In order for your company to meet compliance requirements, the following reports can be produced.
blog_av4
Reports can be saved or scheduled in either PDF or Excel format. Filters can also be applied to reports that you view online.
Alerts can also be configured in Audit Vault. Notifications can also be set up to enable users or a security officer to be alerted where appropriate.
How can I backup Audit Vault data?
Audit Vault comes with a backup utility which ultimately runs RMAN in the background. As expected, you can run a full or incremental backup strategy as well as cold backups if desired.
How can I monitor Audit Vault?
Audit Vault can be monitored via OEM. To accomplish this, you must download and deploy the AV Enterprise Manager plug-in and discover the targets. The Audit Vault home page displays a high level view from which you can drill down to display individual components.
The Summary section of the home page displays the following.
AV Server version
Status of the AV Console
AV Repository Name and status
Number of AV agents
Number of source databases
Number of collectors
blog_av5
You can also see information on your AV agents, Audit Trails and historical information on any upload issues.
blog_av6
Written by Les Hopkins, Lead DBA, Cintra NY – June 2017
Tags:access control, archiving, audit vault, Backup, centralized auditing, external storage, failover, high availability, monitoring, oracle audit vault, switchover, targets, tde, transparent data encryption
Share on Facebook Share on Twitter Share on Reddit Share on LinkedIn Comments Off on Oracle Audit Vault: A Primer
Oracle Database Appliance X6-2 S/M: Optimized and Cost-effective Database Platforms
Published by Cintra DBA team in ENGINEERED SYSTEMS, ORACLE on June 15th, 2017
The Oracle Database Appliance (ODA) X6-2S and X6-2M are two of the latest ODA models released by Oracle which offer greater simplicity, increased optimization and flexibility as well as the ability to support several types of application workloads, deployment solutions and database editions.
In addition to the various customizable solutions that the ODA X6-2S and X6-2M offers, the configuration options for the ODA are much simpler as well as adaptive to cater to customer needs and Application requirements. (more…)
Tags:acfs, asm, backplane, cabling, engineered systems, hardware specs, oda, oda x6-2, oda x6-2m, oda x6-2s, OEM express, Oracle Database Appliance, software, x6-2m, x6-2s
Share on Facebook Share on Twitter Share on Reddit Share on LinkedIn Comments Off on Oracle Database Appliance X6-2 S/M: Optimized and Cost-effective Database Platforms
Weblogic Thread Monitoring: Your Finger on the Pulse of the Middle Tier
Published by Cintra DBA team in BEST PRACTICES, ORACLE on May 31st, 2017
Introduction
WebLogic thread monitoring is very important for all slow or hanging application server issues. All WebLogic (middleware) requests are processed by thread pool thus it becomes a very important place to check for the problems. In Oracle DBA terms it’s very similar to checking database active sessions.
Weblogic server architecture
Weblogic server has a centralized AdminServe that allows deployment and configuration of resources like JNDI configuration, JMS (Java Message Services), Data Source (database connection pools). WebLogic server can have multiple managed servers. All managed servers can co-exist individually and they can be clustered as well.
BLOG Weblogic 1
Each WebLogic server processes different classes of work in different queues, it is based on priority and ordering requirements and to avoid deadlocks.
Weblogic server uses a single thread pool, in which all types of work are executed. Weblogic server prioritizes work based on the rules and run-time metrics and it automatically adjusts the number of threads. The queue monitors throughput over time and based on history data it adjusts the number of threads. It can increase and decrease the number of treads of Weblogic managed server.
For each Managed server and AdminServer we can monitor the threads, which is an effective way to monitor the workload on Weblogic servers.
The Admin Console
The most common mechanism to monitor Weblogic server is the Administrative console, which runs on AdminServer. From console we can administer each managed servers of the domain, like startup/shutdown and configuration of various properties.
We can login using the Weblogic username and password. Administrator superuser is usually weblogic user, which is created while creating domain. Using this account we can create other accounts which can be administrator or less privilege users for only monitoring purpose.
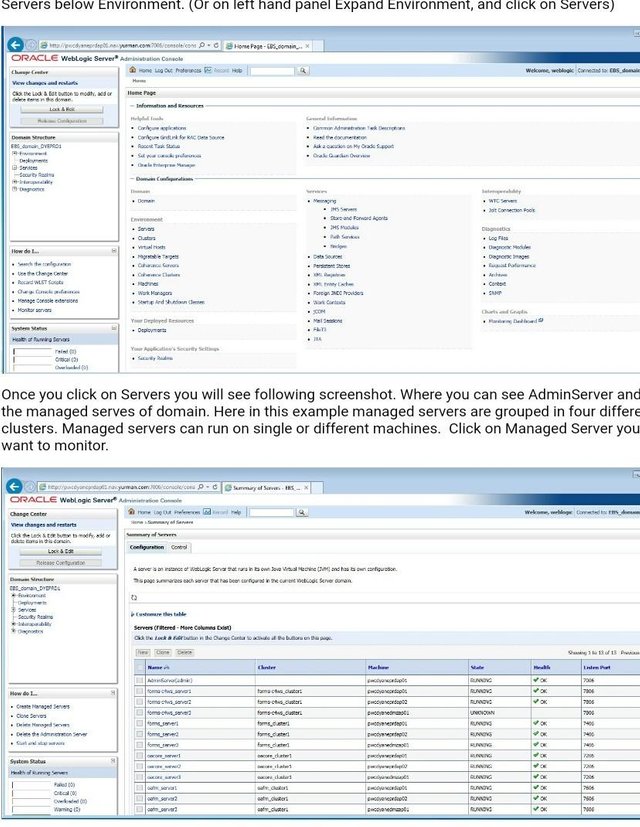
After logging in you will see following screen. To check AdminServer or Managed Server click on Servers below Environment. (Or on left hand panel Expand Environment, and click on Servers)
BLOG Weblogic 2
Once you click on Servers you will see following screenshot. Where you can see AdminServer and all the managed serves of domain. Here in this example managed servers are grouped in four different clusters. Managed servers can run on single or different machines. Click on Managed Server you want to monitor.
BLOG Weblogic 3
Thread monitoring
Once you click on server, to monitor threads click on Monitoring and then Threads tab and you will see following screen.
BLOG Weblogic 4
On above screen, you can monitor further threads by clicking Next (On right hand top corner of the Table: Self-Tuning Thread Pool Threads).
You can customize table to display all of the threads on one single page by clicking Customize this table and select Number of rows displayed per page value from drop down. You also can select or de-select columns to display in table.
Console will remember this setting when login next time for the specific managed server.
BLOG Weblogic 5
Thread state
To check issues of slow application response or hanging application you should be interested in Hogger and Stuck threads.
Let’s understand about thread state.
Active: The number of active execute threads in the pool (shown in Self Tuning thread pool table first column).
Total: Total number of threads.
Idle: Threads that are ready to pick up new work.
Standby: These threads are activated when more threads are needed, these threads remain in standby pool and activated when needed.
Hogging: Thread held by a request. These can be potential stuck threads after the configured timeout or it will return to pool before that.
Stuck: Thread is stuck working on request for more than configured stuck thread maximum time. You can imagine Stuck thread as long running job. Once the condition causing the stuck threads is cleared they will disappear and back to thread pool.
The Managed server status will show Health as Warning when you have Stuck threads in thread pool.
To identify potential issues or to check Stuck threads, there are various methods:
On Admin console, sort the Thread pool table based on Stuck in descending order, or you can check threads with Stuck column value as True and look at the Current request column and thread ID. Using thread ID, you can able to check what this thread was doing before became STUCK.
You will have complete detail of Stuck thread in the managed server log file on the server node. In the managed server log, look for string ‘BEA-000337’ or ‘STUCK’ word and timestamp. The log entry will show all about the request and potential problem or current problem. Advantage of log file is we can check the historical STUCK thread occurrences as well.
To understand more about STUCK threads, you can take thread dump by clicking button “Dump Thread Stacks” on thread monitoring page and you will have complete dump of all threads in pool. You can then locate all the STUCK threads in dump and you can understand more about STUCK threads.
Summary
By monitoring WebLogic servers using Admin Console or by checking log files you can identify potential issues or ongoing problems of slow or hanging application.
To learn more, or for assistance with any Weblogic issues, contact Cintra today!
Written by Dilip Patel, Senior Oracle Apps DBA, Cintra UK – May 2017
admin console, admin server, hogging, managed server, monitoring, server architecture, stuck thread, stuck threads, thread, WEBLOGIC, weblogic architecture
Share on Facebook Share on Twitter Share on Reddit Share on LinkedIn Comments Off on Weblogic Thread Monitoring: Your Finger on the Pulse of the Middle Tier
ZFS Storage: All That Flash, All The Time
Published by Cintra DBA team in ARCHITECTURE, STORAGE on May 31st, 2017
Back in February Oracle announced its NEW ZS5 Storage Appliance. The ZS5 Storage Appliance was designed to deliver high performance across the board for all applications.
Oracle has been building the ZFS Appliance from the beginning using a powerful SMP design. This design allows all the CPU Cores in its controllers to work effortlessly. The ZFS Appliance also runs a multithreaded OS (Solaris) and the controllers each have very large DRAM caches which gives them great performance, but the new ZS5 models now take advantage of all flash storage enabling the Oracle ZFS Appliance to power some very demanding applications while getting very fast query responses and rapid transaction processing times.
The new ZS5 Storage Appliance comes in two models, the ZS5-2 and the ZS5-4. Both use the latest Intel 18 core processors and both models can be configured with a large amount of DRAM. The ZS5-2 can scale out to 1.5TB of DRAM and the ZS5-3 can max out at 3TB of DRAM. That’s with 36 or 72 Intel CPU cores to make the ZFS really scream with performance.
For the SSD’s Flash storage both models can be configured with all Flash SSD’s.
Each disk storage shelf can be configured with 20 or 24 – 3.2TB 2.5-inch SSD’s. The ZS5-2 can connect to 16 storage shelves giving it a total of 1.2 Peta Bytes of all flash storage and the ZS5-4 can connect to 32 disk storage shelves giving it a total of 2.4 Peta Bytes of all flash storage.
The ZFS Appliance has a built in secret sauce that has been designed to work with the Oracle’s infrastructure stack, also known as the “Red Stack”. This has sped up applications and databases, specifically 12c databases, while delivering efficiency and storage consolidation. Oracle could do this by having their storage engineers work with their database engineers in designing the storage to take advantage of all the software features built into the Oracle database. The ZFS Storage Appliance is truly and engineered system.
A great new feature is that the Oracle ZFS Storage Appliance easily integrates in to the Oracle Cloud, making cloud storage available to all users at the click of a button.
From the beginning the ZFS engineers created Hybrid Storage Pools (HSP). These HSP’s were made up of, DRAM, Read SSD’s, Write SSD’s and spinning SAS hard drives. Together the data was moved in and out of DRAM and through the Read or Write SSD’s and into the SAS drives. Today the ZFS engineers have created a Hybrid Cloud Pool, (HCP) which pretty much acts the same way but only in the Oracle public cloud.
BLOG ZFS Flash 2
The best part of this integration to the Oracle Cloud is that it’s FREE! Another benefit is that the new ZFS Appliance also eliminates the need for external gateways. It is all built into the ZFS controllers.
Truth be told Oracle has been using the ZFS Storage Appliance in its own cloud since it purchased Sun Microsystems 7 years ago.
And finally, as you evolve your storage model, you’ll want to extend what you’re doing on-premises to the public cloud. And, ideally, you’d do this easily and seamlessly with the new ZFS ZS5 Storage Appliance.
Written by Chris Brillante, Sr. Solutions Architect, Cintra NYC – May 2017

*Join Me* @aemkar