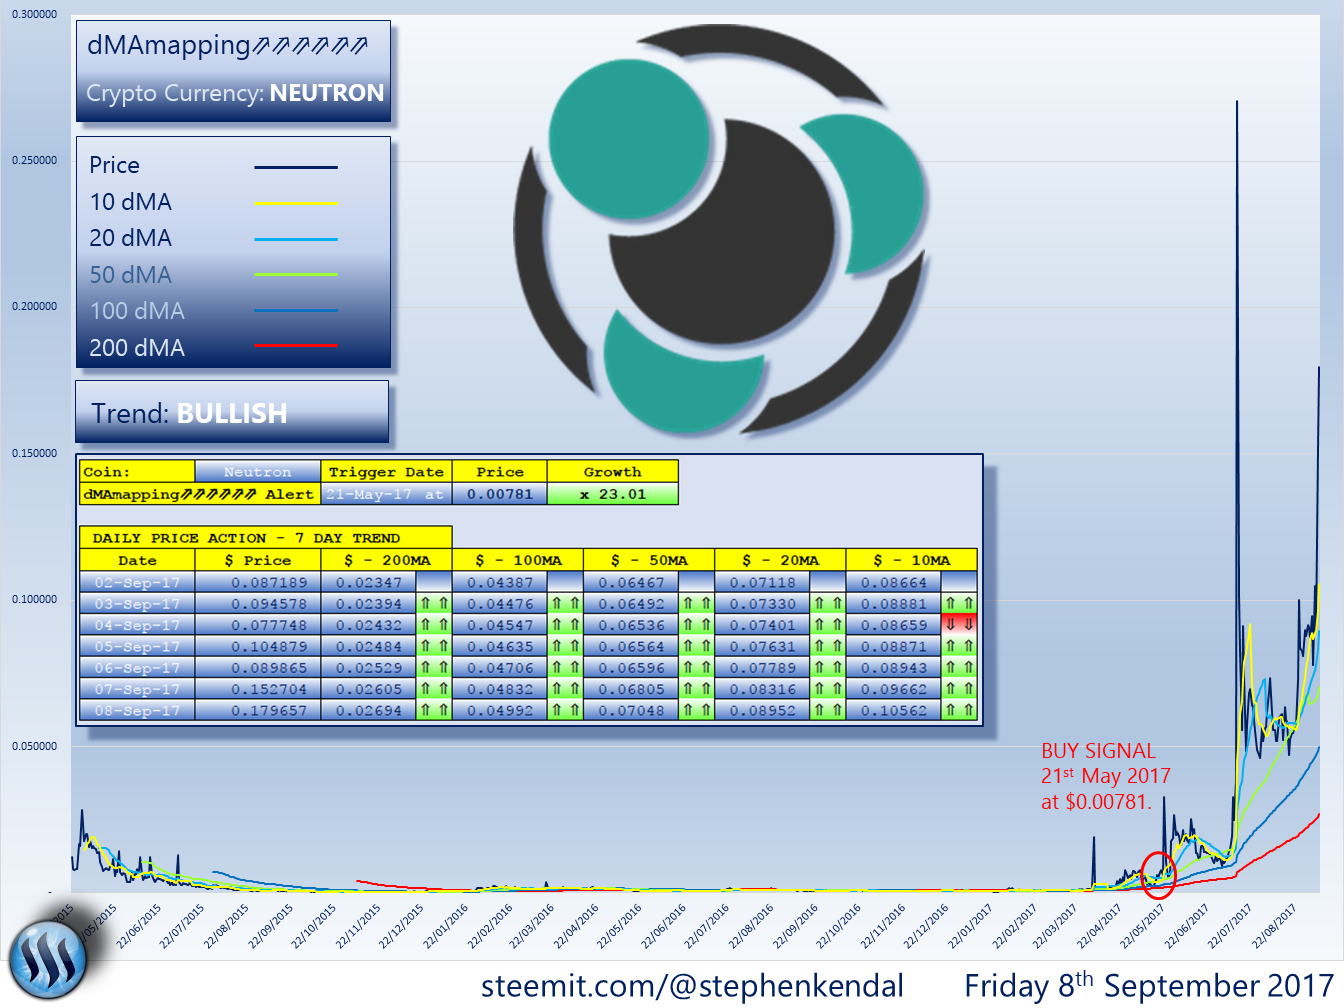
From triggering the dMAmapping⇗⇗⇗⇗⇗⇗ buy alert, Neutron has seen a staggering growth of no less than x 23.01 to the current price of $0.179657. Remains bullish.
#Neutron Price Chart
#Neutron #dMAmapping⇗⇗⇗⇗⇗⇗ Screen
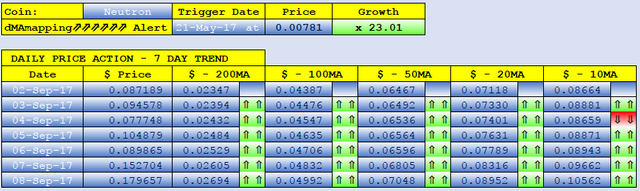
#Neutron triggered a #dMAmapping⇗⇗⇗⇗⇗⇗ buy alert Signal on 21-May-2017 at $0.00781.
From triggering the #dMAmapping⇗⇗⇗⇗⇗⇗ buy alert, #Neutron has seen a staggering growth of no less than x 23.01 to the current price of $0.179657.
With a current Market Capital of approx. $5m and Ranked No.264 in the #CryptoCurrency Market, #Neutron has seen an explosive growth these last 4 months.
We maintain a BULLISH recommendation on #Neutron and will continue to monitor the #technicalanalysis over the next few weeks/months.
Thanks again for reading.
Stephen
Shared on twitter. Stephen
Excellent post, Very Informative about Neutron :)
nice
ME TOO
I don't really understand these alerts....this seems like an after-the-fact alert. Do you post alerts before these crazy runs happen?
These alerts are posted when they happen and we share those that we feel people are interested in. Many people have their different takes on how to apply Technical Analysis with 1,000's if not 10,000's of different permutations of technical signals. There are many who apply Fibonacci, bollinger bands, supports, resistances, traces etc etc but 5 years ago I set about going back to basics and wrote my own. The simple reason being all known common signals are pre-programmed into algorithms to trigger the opposite. The system I developed 5 years ago maps moving averaging and was back fitted over 100,000's Stocks and PMs and it was this back fit that then gave us the formula. This formula is then applied and the results have been amazing. Last year we unbolted the software and fitted it to the Crypto Currency Market and have not at all been surprised with the results. We suggest anyone new to Technical Analysis to follow our alerts for at least a year to feel comfortable with the signals. I have been studying Technical Analysis now for over 25 years and it is very hard to teach. The best way to fully understand Technical Analysis is to learn the basics and for anyone starting out give yourself at least 5 - 10 years to fully become familiar with it. After 25 years if you put a chart in front of me I could tell you which direction it is going and get it 90 - 95% right. So even after 25 years I am still learning. Hope this helps and good luck if you are just starting out and suggest you follow them for a year to understand how they perform. Thanks for the comment. Stephen
informative post ..thank's for sharing
You are very welcome. Stephen
Nice work sir