More Correction Charts - NEO, Dash, EOS and Tron
NEO
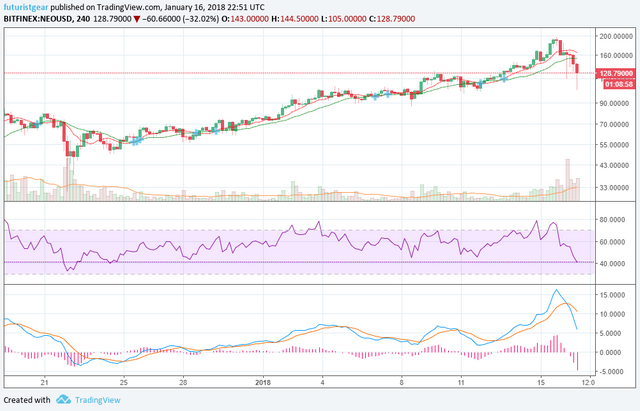
NEO has been late to the correction party, only giving a sell signal on the MACD this morning (in my timezone anyway) and it appears to finally jumped aboard the correction train:
https://www.tradingview.com/x/hQS50ssk/
4 Hour Chart
The RSI is now on the bearish side of things too, and it appears that NEO may have reached the end of its current rally.
Considering NEO was one of the last currencies to enter a corrective phase, it might take longer than Bitcoin or Litecoin to find a bottom.
DASH
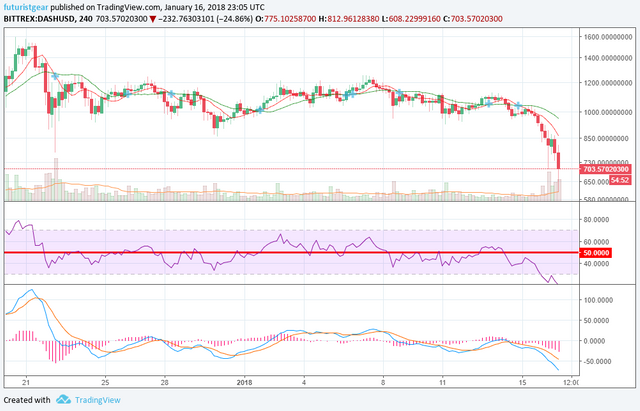
Oh Dash, the digital cash has joined the crash. Prices for Dash have fallen as low as $620 (ish) today, and we're currently trading around the $700 mark.
The RSI and MACD remain bearish (unsurprisingly) and the RSI is now getting into the oversold region:
https://www.tradingview.com/x/loOYCTET/
4 Hour Chart
Since DASH began correcting along with BTC and LTC, it may find its bottom a little sooner than NEO too.
In the very short term, there may also be some bounce here due to the oversold reading, but I won't be adding to my DASH holdings right now.
EOS
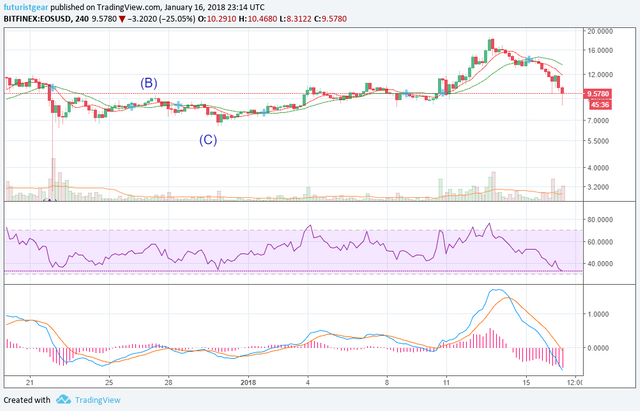
I haven't charted EOS much apart from the other day when I said it could just be getting started.
It seems that unlike with my recent Bitcoin and Litecoin predictions, that I was right, but it has now also joined a lot of the other coins and turned lower too:
https://www.tradingview.com/x/0xNVfQ0o/
4 Hour Chart
The MACD for EOS is bearish, but the RSI hasn't hit an oversold reading here (yet?) so some more downwards pricing is quite possible here.
As always, it pays to keep an eye on things and wait for more bullish signs!
Lastly...
Tron (TRX)
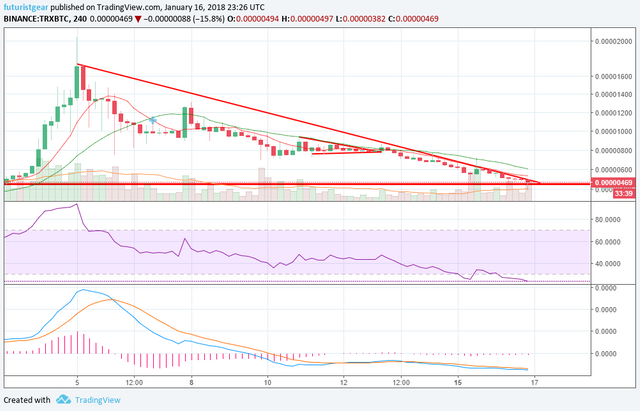
I thought Tron was reaching the bottom just the other day, and might have even been breaking out of a bullish triangle pattern. It did, but it turned out to be a fakeout and it has headed slightly lower - in ETH terms - since then.
Also In ETH terms, it does like TRX has reached a bottom level, but is at around $0.05 or so the last time I checked, and has been following the rest of the market by correcting too.
https://www.tradingview.com/x/bUPvE9YY/
4 Hour Chart
I'm not saying that above line is a triangle, but that could be a sign of a possible breakout point against the ETH pairing, with the support level holding and the RSI reaching an oversold level.
Maybe, TRX will get a nice bounce against Ether pretty soon. We'll have to wait and see!
HODL!
I hope you're HODLing strong, or getting ready to inject some fresh FIAT when things start looking up again. If you have any thoughts on the 4 names above? Drop them below!
Thanks for reading!
For more awesome technical analysis and crypto related posts, see also: @toofasteddie, @gazur, @ew-and-patterns, @pawsdog, @cryptomagic, @exxodus, @beiker, @allthereisislove, @lordoftruth, @masterthematrix, @cryptoheads, @tombort, @maarnio & the newest addition @steemaze
Not investing, financial, or trading advice.