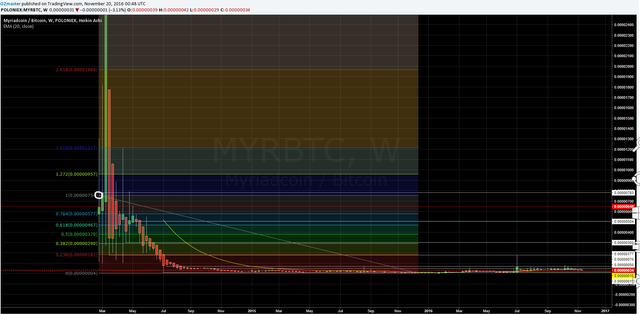
$MYR/BTC Technical Analysis 19th Nov. 2016.
Hello Steemers!

Decided to share my $MYR/BTC chart with you today.
$MYR was heavily dumped in the past but shown sign's of life after hitting a critical low level and has been in a slow uptrend ever since. All in all looks like an rather appealing market to me.
I will be showing weekly and monthly charts, with target based on those, call it long term targets.
Furthermore I did not start off with a crazy amount of lines as usual, i rather took only a few which i saw as important to try and keep it as simple as possible this time.
For the start lets start with the clean weekly and monthly charts.
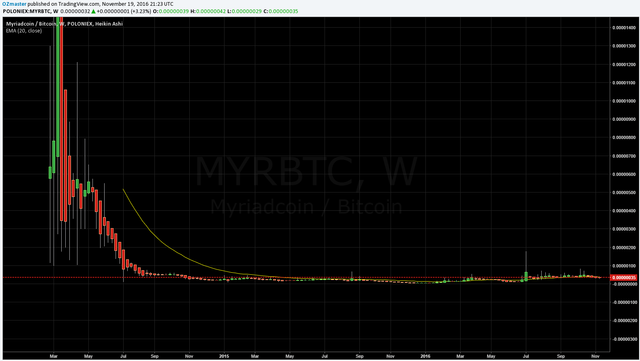
1 week chart Poloniex -clean - Nov. 19, 2016

1 month chart Poloniex -clean - Nov. 19, 2016
One can clearly see here how the price was heavily dumped all the way down to 4 satoshi.
Moving on to add some lines.
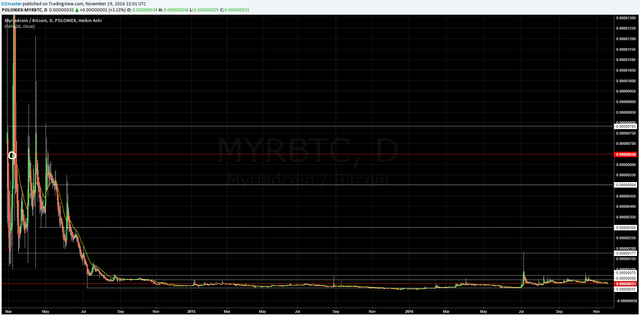
1 day chart Poloniex -lines - Nov. 19, 2016
As mentioned above I didn't take allot of lines this time. I marked those while looking at the weekly chart.
The only 1 more line I'd add after zooming in to the daily is the red line around 650 satoshi.
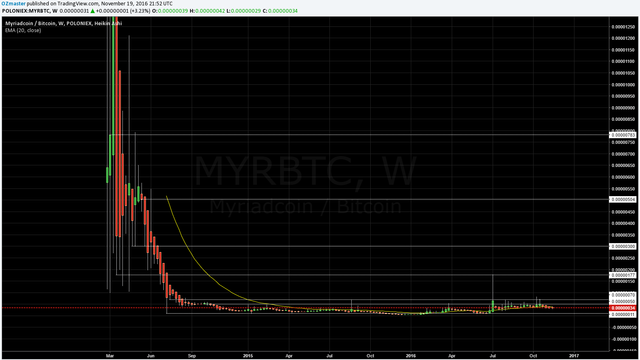
1 week chart Poloniex -lines - Nov. 19, 2016
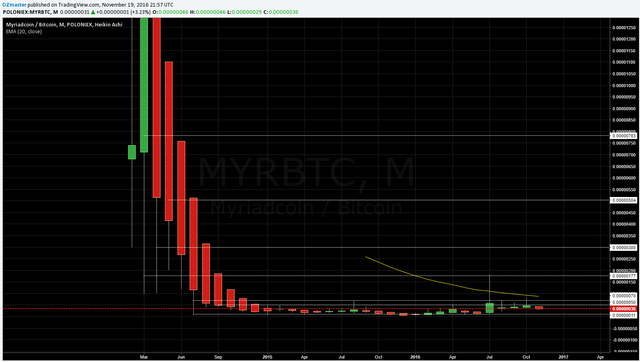
1 month chart Poloniex -lines - Nov. 19, 2016
On the weekly and monthly charts here we can clearly see how the price started showing signs of life after reaching the very low 4 satoshi all time low. Since it had quite a few spikes with some respectable volume behind them, the greatest one being the one on Jul 5th. spiking all the way up to 180 satoshi with an incredible 1444 BTC volume.
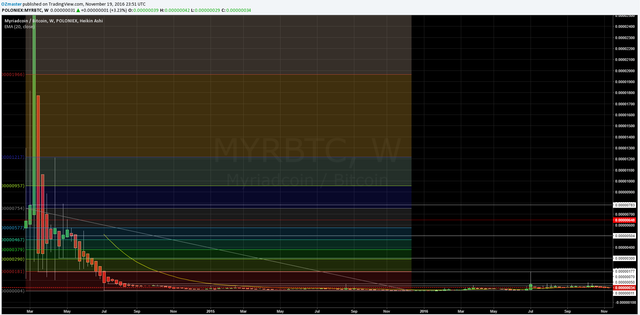
1 week chart Poloniex -fib - Nov. 19, 2016

1 month chart Poloniex -fib - Nov. 19, 2016
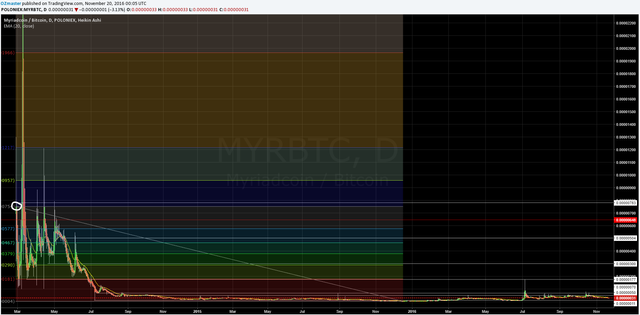
1 day chart Poloniex -fib - Nov. 19, 2016
Added a fib, used the all time low of 4 satoshi and the close of the first daily candle (circled it white on the chart above).
Although the price has been traded very low for quite some time we can see how the bounce on Jul 5th. went all the way up to the first fib level of ~180 satoshi, which indicates to me that the whole area bellow 180 satoshi is just one major accumulation level for $MYR.
what to expect next?

1 day chart Poloniex -zoomed in - Nov. 19, 2016
By zooming in it looks like the price is still in recovery from the hard bounce to 180 satoshi, which could result in it going down near to the local low made just before the bounce, my target in that case would be something around 15 satoshi.
On the other hand the 30 satoshi levels is a historically well marked level and given the volume on the 180 sat bounce it could be used as a bounce point.
COMMENT
Once again, I will post the comment by commenting as it involves my personal opinion!
Thank you for understanding!
If anyone has any questions or need's help fell free to ask, I will try to explain as fast and as best as I can.
Critics, comments, reply's, counters, advice's, etc. are always welcome!
Have my charts helped you in any way?Let me know with a comment below :)
Are there more people who are doing TA?
Please post the links to your TA's posts into the comments as well!
DISCLAIMER
I am showing multiple scenarios on the price movement, in the post itself I do not take any stance, either bullish or bearish. I am not responsible for neither you’re winning nor you're losses upon trading! the "comment" section is my personal opinion and does not mean I have to or do hold any positions in the given market.
Everyone who uses TA develops his own unique charting style, please keep that in mind.
Kind Regards, OZ :)
COMMENT
All in all I would ignore MYR's short term bounces and dumps and would aim for a,,, rather crazy target,,, of around 800 satoshi
