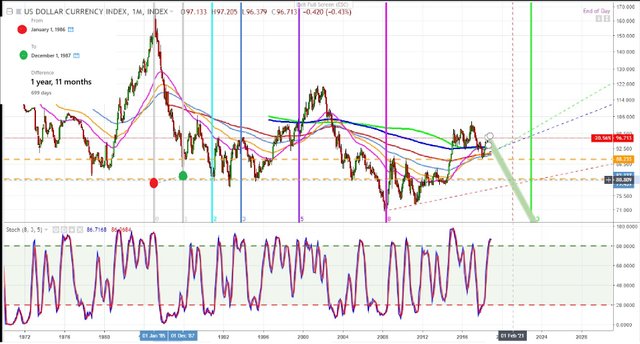
US Dollar With A 700 Day Cycle
1yr. 11 months for the US dollar cycle. The month of December isn't complete yet but if the trend continues down up to January, look for the possibility of the US dollar going down for the year of 2019.
First chart - The US Dollar ........ The monthly chart is showing the momentum indicator overbought and rolling over. Will have to take a look again at this on January 2nd.
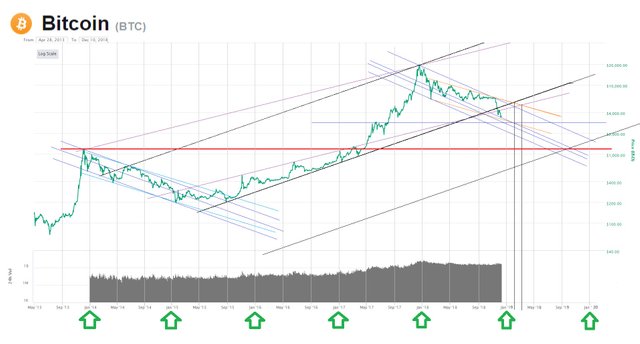
Second chart - Bitcoin broke ascending support a while ago on the Log chart, could see a rebound to the resistance area shown with the 2 black vertical lines. The arrows indicate January 1st for every year. There's usually a pivot point around the start of the new year, a change of direction. So, we've been going down.... should go the other way.
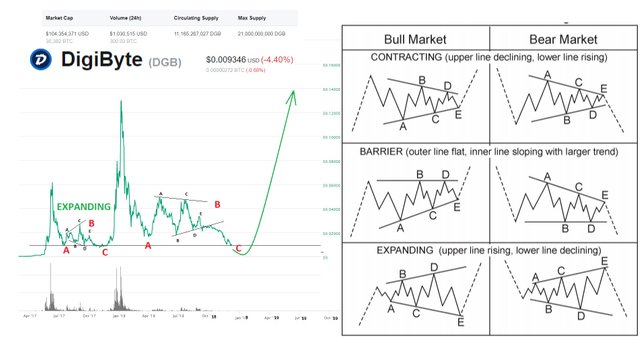
Third chart - DigiByte with 2 triangles..... one expanding and the other is a contracting. The price enters the triangle, has 5 waves and then exits the triangle .......... the exit is the final move. A triangle can only be a B wave in a corrective ABC wave or wave 4 in an impulse wave 12345.
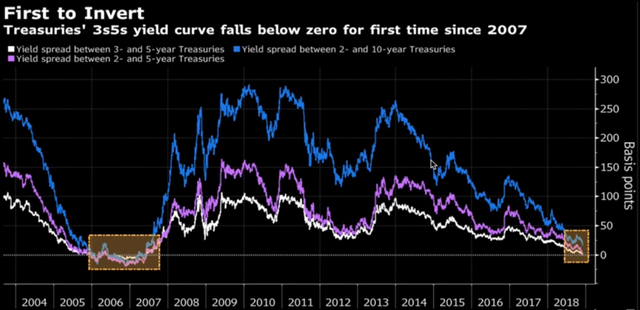
Fourth chart - The yeild curve is starting to invert..... there's lots of info on this all over the internet. Basically, banks borrow short term and then lend long term and the spread is there profit. If short term debt costs more than long term, banks loose money....... banks never loose money because they're the people that create the debt. So they stop lending, and the price of the debt goes down and the yield goes up.
This is the way it's supposed to work but the system is broken so who know's what the heck is going to happen.
History indicates that it usually ends up with the country who is owed the debt invades the debtor country, rapes and pillages, kills everyone and then the debtor country is taken over by the lender.
All data and information provided is for informational purposes only. Trend Wizard makes no representations as to accuracy, completeness, currentness, suitability, or validity of any information in this post and will not be liable for any errors, omissions, or delays in this information or any losses, injuries, or damages arising from its display or use. All information is provided on an as-is basis. I document this stuff for personal reasons as a log and share with the community...... only because I'm a nice person.
So in ending........ Use critical thinking and think for yourself.