The Stock Market 5 Wave Wedge With Extreme Greed
When the stock market shows extreme greed and the chart has an ending 5 wave wedge, it's time to pay attention.
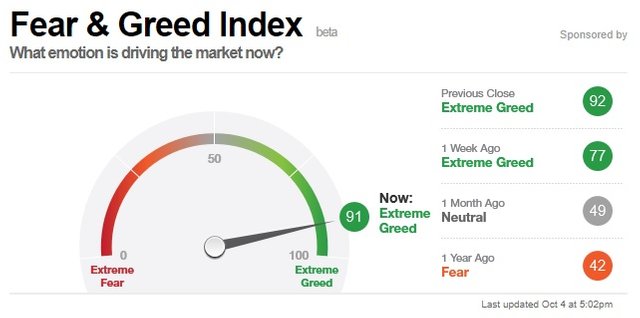
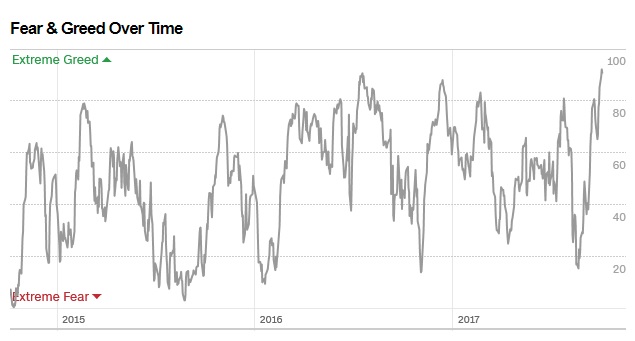
Below are some screen shots of the fear and greed index taken from - http://money.cnn.com/data/fear-and-greed/
No matter what's bought and sold, the price turns at extremes.
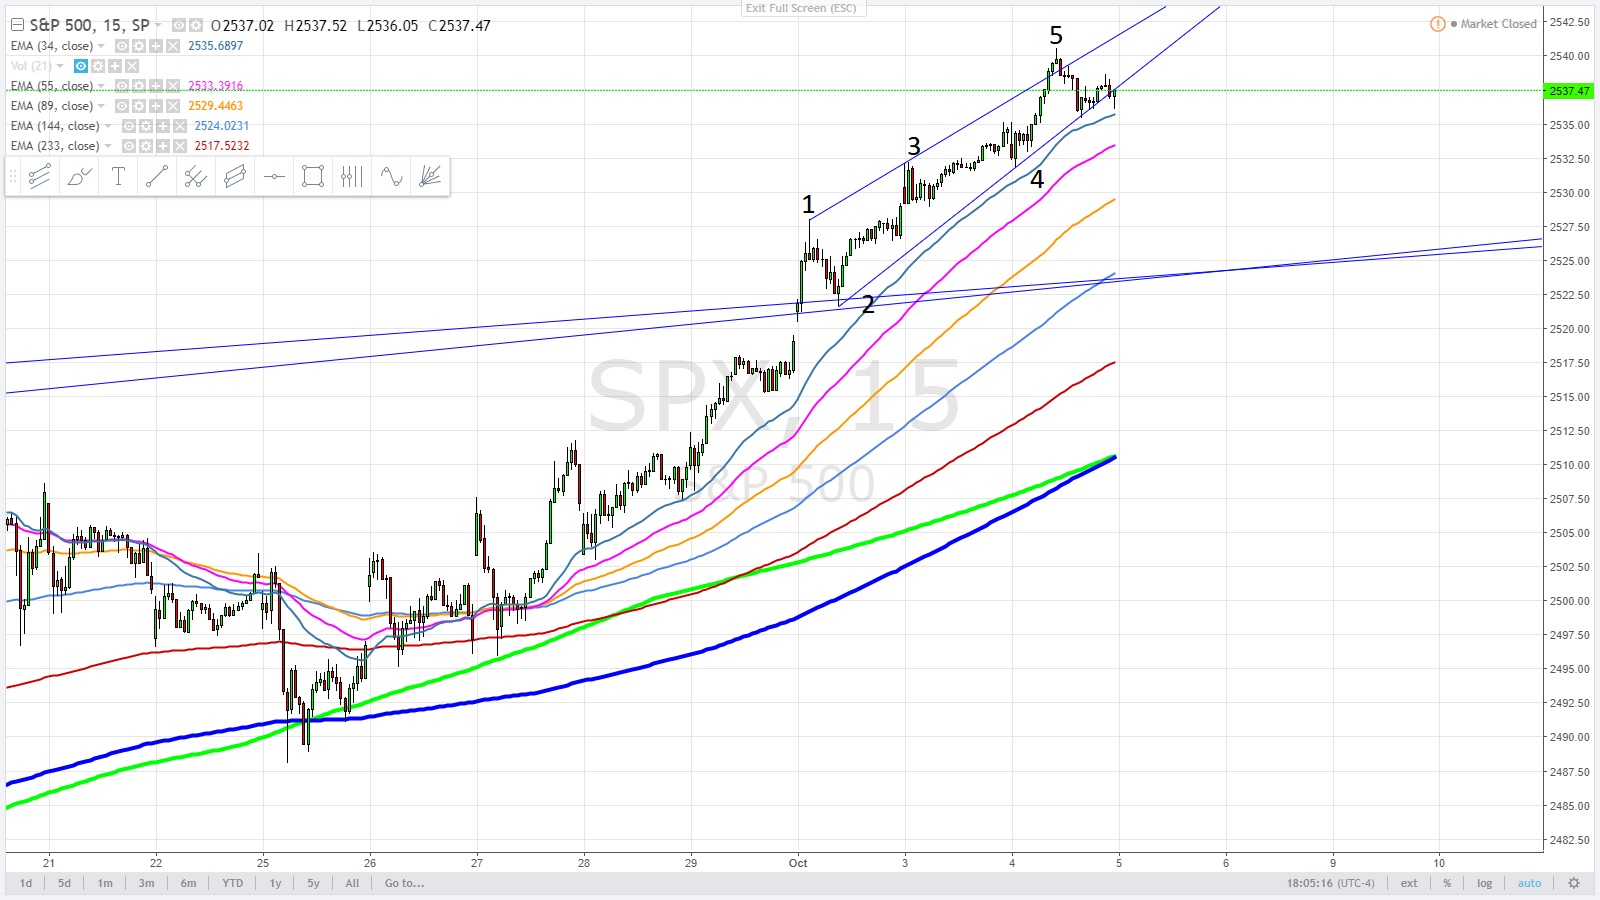
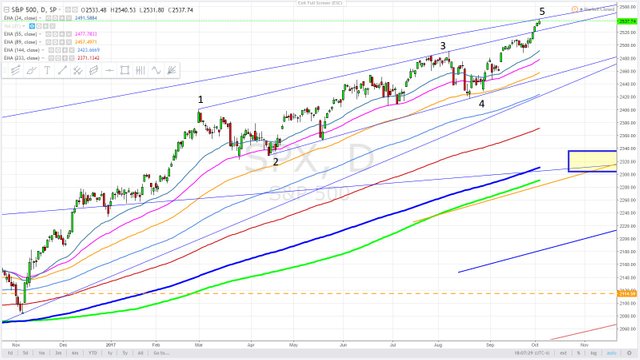
Looking at the charts below the fear and greed index, the first chart is a 15 minute cycle chart showing a 5 wave wedge. The wedge is a classic ending pattern.
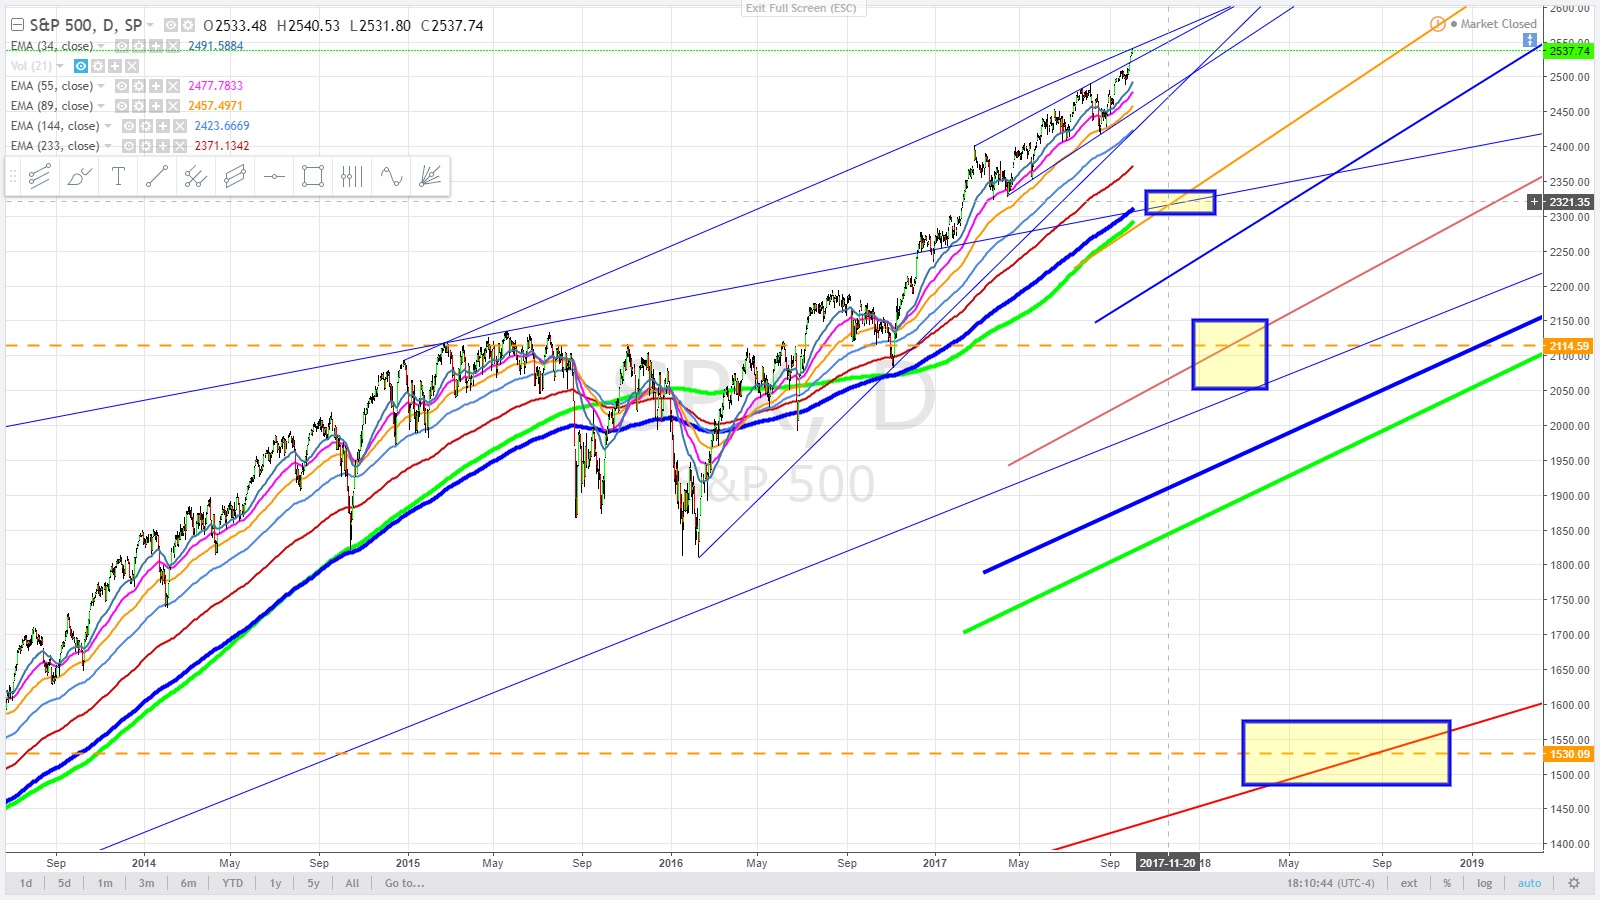
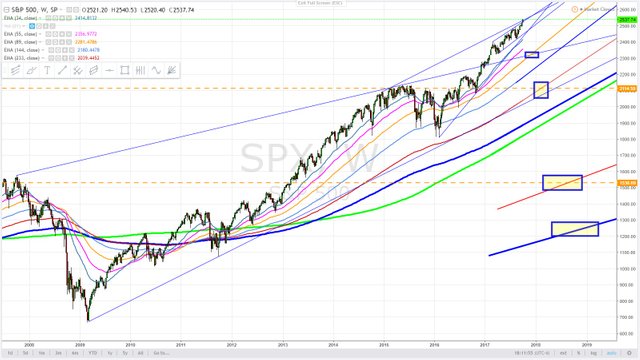
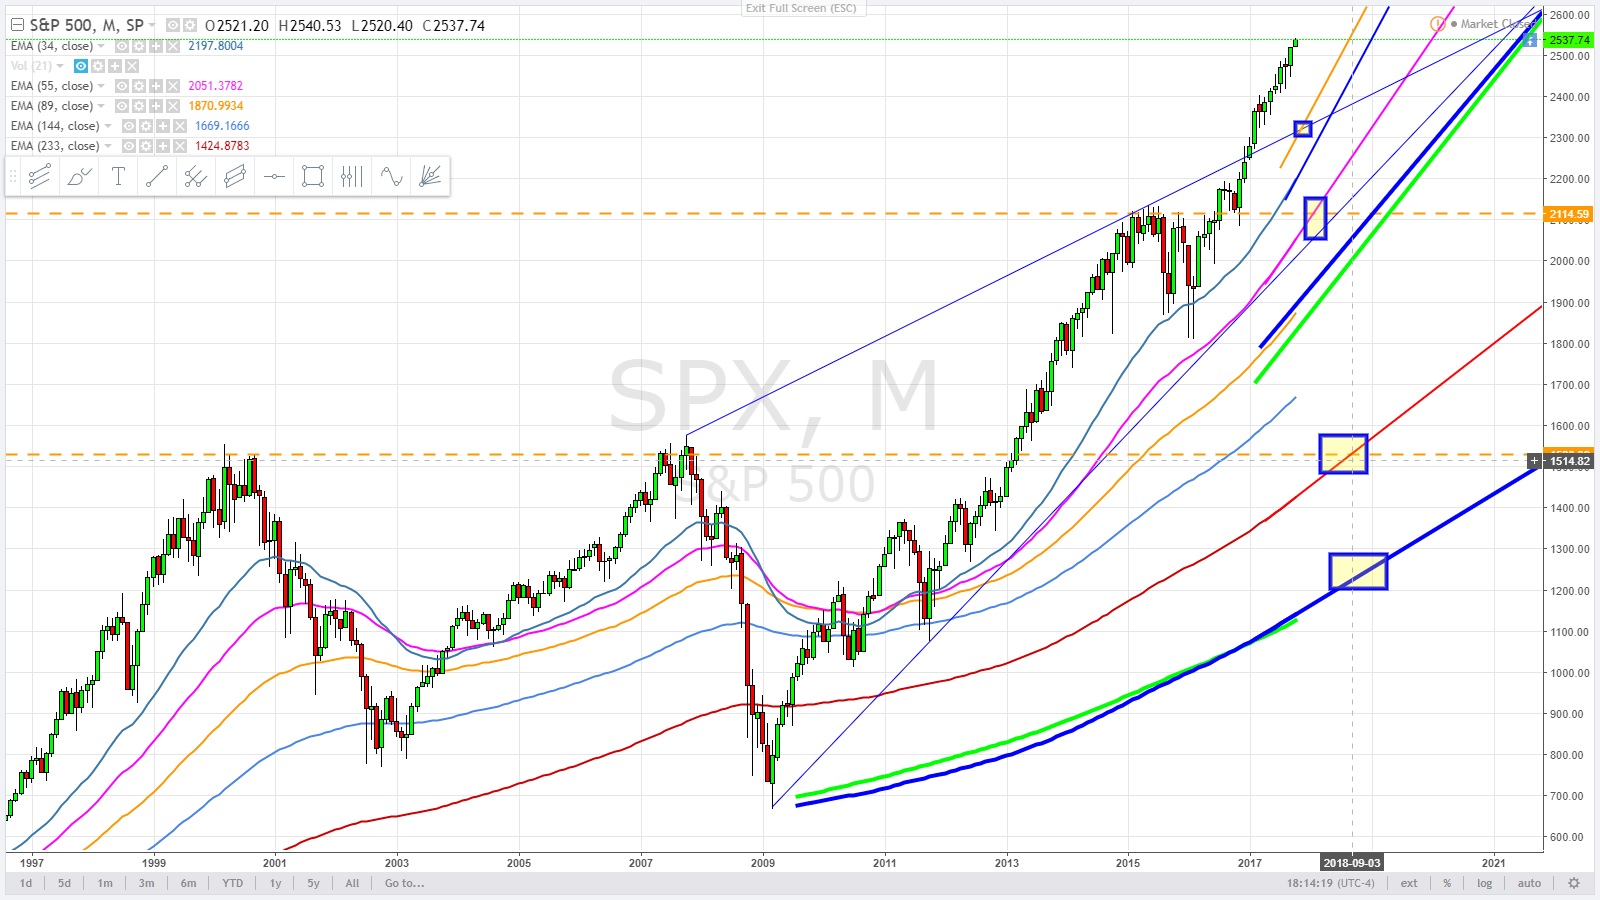
The boxes in the daily, weekly, monthly charts are targets ........ ASSUMING ...... the trend would continue. Doubt it though.
One target at a time of course.
First target 2300.
Key take away.... this is important........ if a bearish pattern doesn't go bearish. The market would be still bullish and the patterns null and void. The opposite happens on the down side as well.
http://money.cnn.com/data/fear-and-greed/
http://money.cnn.com/data/fear-and-greed/
http://money.cnn.com/data/fear-and-greed/
All data and information provided is for informational purposes only. Trend Wizard makes no representations as to accuracy, completeness, currentness, suitability, or validity of any information in this post and will not be liable for any errors, omissions, or delays in this information or any losses, injuries, or damages arising from its display or use. All information is provided on an as-is basis.