WTI’s Perfect Bearish Storm Approaching Key Support Near 25.00
Even in a lifetime of an oil bear’s wildest dreams, it would be impossible to conceive of a more perfect storm for oil prices falling precipitously:
- Crude faces arguably its largest demand shock in history from the coordinated pandemic-induced shutdown of commerce across the globe…
- …While Saudi Arabia and Russia drastically ramp up supply in an effort to drive other producers out of business…
- …and the U.S. dollar, in which oil contracts are denominated, surges to test multi-year highs…
- …and risk appetite evaporates due to the aforementioned spread of COVID-19
Put in that light, some analysts could argue that its amazing that oil is down “only” 53% so far this year.
Of course, like any commodity market, there are fundamental factors on both the supply and demand side that will bring the oil market back into balance over time. As prices fall below the cost of production in many area, higher-cost drillers will be forced to shut down operations, eventually decreasing the supply. Even Saudi Arabia and Russia cannot afford to sell at a loss indefinitely.
At the same time, the lower price of oil will increase marginal consumption, through consumers taking an extra car trip (once coronavirus fears blow over) or businesses utilizing more petroleum derivatives to produce their products. The U.S. government, recognizing the potential value the drop in prices creates, has promised to refill the Strategic Petroleum Reserve (SPR). While analysts have noted that the SPR can only hold about another 80
M barrels, or new buying of about 225k bpd for the next year, this mirrors the decision that other countries and investors are considering.
Of course, all these trends will play out over a longer time period. In the near-term, the technical outlook for oil remains bleak. Focusing on WTI, prices remain in a clear downtrend for the moment, with the next major level of support sitting down in the 24.50-26.00 range; this represents the confluence of the lows from Q1 2016 and all the way back in Q4 2012/Q1 2013:
WTI Daily Chart 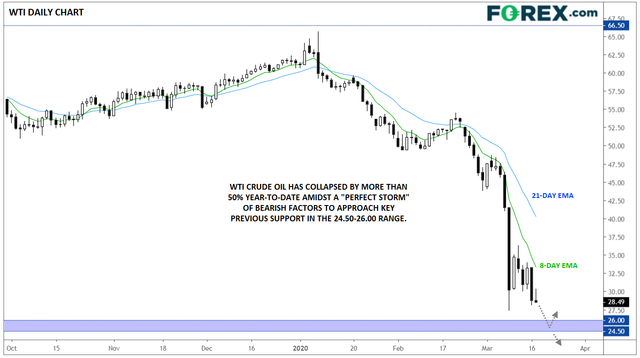 WTI Daily Chart
For short-term traders, the most prudent course of action may be to remain short on oil until this support level is hit or price recovers back above its 21-day EMA (currently around 40.00 but falling fast). If price shows signs of turning higher from this support zone (perhaps through a reversal candlestick pattern and a bullish divergence in an oscillator like RSI), traders could consider closing short trades or entertaining counter-trend long positions.
Of course, if price breaks through this potential floor, a continuation lower could be in the cards, with the potential for oil to fall toward $20.00 even, as incredible as that is to consider based on where we were at the start of the year!