BTCUSD, BCHUSD and DXY comparison since the fork!
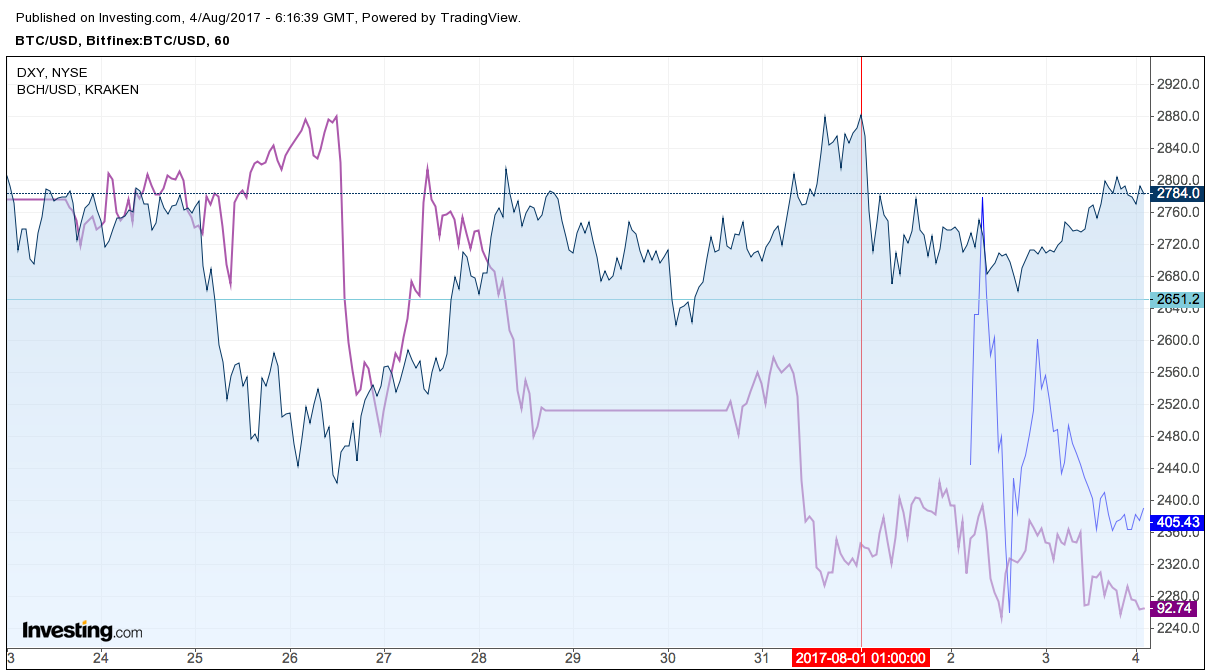
Friday 4th, August 2017 0718 BST - Bitcoin has been consolidating around the $2,700~$2,800 range since the fork which caused a sharp fall from the $2,900 level close to the ever hopeful $3,000 glass ceiling.
Bitcoin Cash on the graph above in Blue - with data available since the 2nd we can see a sharp appreciation at start and then a sell off towards support around $400. Is this the fair value or will we see the market deprecate, Q4 will be a telling time for the pair past the August 1st split.
The Dollar Index a trade-weighted index measured against a basked of currencies which reflects the US Dollars purchasing power is continually dragging down past the previous years low in a 14 week downturn.
Commodities, Cable and Euro have been buoyed by the weakness, if BTC is receiving the same correlation - a strengthened Dollar in turn of Fed balance sheet normalisation, change of policy or increase in Bond yields could see new levels emerge.
Levels To Watch
DXY rising above 93~95
BTCUSD Support $2,600
BCHUSD Support $400