Hindenburg Omen Predicts This Market is Going Down in Flames!
The Hindenburg was a giant German passenger blimp. Similar to Titanic, the Hindenburg disaster is famous for horrifically killing many of its passengers. In 1937 the blimp, while attempting to dock at a U.S. Naval base in New Jersey, caught fire killing 35 of its 97 passengers.
According to Wikipedia:
"The disaster was the subject of spectacular newsreel coverage, photographs, and Herbert Morrison's recorded radio eyewitness reports from the landing field, which were broadcast the next day."
Which apparently is why no one rides blimps anymore..
The Hindenburg Omen
Tell me this, would you like to have known about the 2001 tech crash a year earlier in 2000? Or what if you could have side stepped one of the largest financial meltdowns in history in 2008? Would you be interested?
The Hindenburg Omen, which just sounds ominous, is a Stock Market indicator designed to do just that. Predict the likelihood of a Stock Market Correction. It does this by measuring the breadth of the market. So basically, how many stocks are making new 52 week highs vs how many stocks are making new 52 week lows. And right now there are A LOT of losers out there and a dwindling amount of winners, think the popular FAANG stocks (facebook, apple, amazon, netflix, google).
The problem is that, historically when this happens, the hot stocks holding up the market eventually roll over as well. You see in popular indexes such as the Nasdaq and the Dow Jones Industrial, all stocks are not equally weighted.
For example, according to Goldman Sachs 5 Stocks account for 42% of the Nasdaq!!! In case you're wondering, the Nasdaq has over 3000 companies. What happens to the index when 1 or 2 of these companies has a correction?
So How Accurate is the Hindenburg Omen?
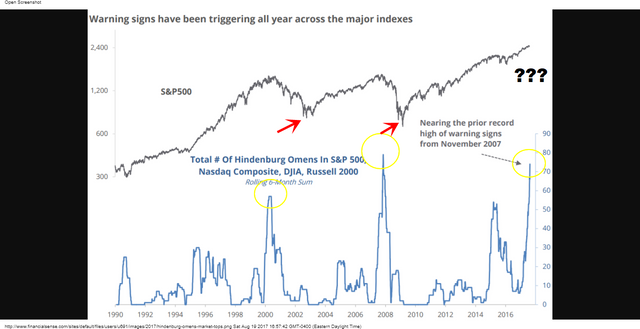
Here's a chart I pulled from Jason Goepfert at SentimentTrader.com
While there are some false breakouts, there's clearly a strong correlation between when this indicator spikes above 60 and when the market is about to tank. Currently this indicator is reading above 70, the second highest after the '08 crash. While no one indicator is 100% correct, you can see there's definitely cause for concern and multiple indicators flashing warning signs as I wrote about in my last article:
"This Indicator has Predicted the last 7 U.S. Recessions. What's it saying now?"
So what now?
If you're like most Americans, the vast majority of your savings is tied up in the stock market through IRA's and 401k's. In 2001 and 2008 the market corrected by 50% and took years to recover those gains, devastating the accounts of those interested in retiring in that time frame.
The average bull market lasts 6-7 years, this one just turned 8. If you think stocks will go up forever, then by all means don't let me dissuade you! After all there were some survivors on that blimp. But you make money in the market by buying low and selling high. Currently the stock market is at record highs, does this look like a good time to buy to you?
A prudent investor might consider taking some profits and increasing their cash position to await a more attractive buying opportunity. I know I am.
Until Next time.
It's your move.

JESS
This Indicator has Predicted the last 7 U.S. Recessions. What's it saying now?
"Unbelievable, Outrageous...." Wells Fargo Scandal Broken Wide Open.
Silver Marks Biggest Daily Jump in 11 Months
Think your Bank is safe? Wells Fargo Rips off customers.... again.
I did withdraw all my positions on the market early this year. Maybe a little too soon but I sleep soundly now ;)
Definitely, and good for you. noone can predict the future, but i like Jim Rogers investment philosophy- buy value. If everyones bidding up the price of something. Youre probably not going to make any money on it
I'm expecting a catastrofic market crash any day now. Great post!
Thanks @cryptoeagle ! with the interventionist central bankers its tough to make short term predictions