Nasdaq Futures Approach Fibonacci Cluster
In this post I am going to take you through a step by step construction of a fib/symmetry cluster. I have had many questions about how I identify and create these zones so I wanted to take the opportunity in real time to show how the work is done.
But first, a few definitions:
Projections: To project a move you need three price points. A high to low, then projected from a high, or a low to high then projected from a low. Projections are used to find market symmetry, or moves of similar magnitude in the same direction.
Retracements: Retracements require two price points and are used to identify possible support or resistance at key ratios in relation to a prior move. The most common are .236, .382, .5, .618, and .786. A retracement get its name from the fact that the original move is literally being retraced. For example, is someone says that a move terminated at the .5 of 50% it means that if the stock started to decline at $100 and fell to to $50, then a 50% retrace would be a move to $75.
Extensions: An extension is any value above a 100% or whole retracement. To keep the same example, if the stock fell to $50 but then exceeded the prior high of $100 (or low) it would be called an extension. The most common extension ratios used to identify key price points are the 1.272, 1.618, and the 2.618.
I will now demonstrate one by one how these ratios were plotted and used on the current setup in the Nasdaq 100 E-Mini futures contract.
First, check for retracements from the major high and low that is obvious on the chart. I am using the 4/17 low and the 6/8 high to check for retracement relationships. After I draw the retracement I notice that the .618 ratio is not too far away from current prices. Next, I will check for any extension relationships.

Now on to the extensions. To use an extension we must be using a value over 1 to literally extend past a previous move. In this setup I use the 6/15 low and the 6/26 high to create an extension value. The extensions value can be calculated by finding the difference in the two points used and then multiplying using the ratio. To calculte the extension in this example subtract the low from the high. 5852-5641= 211. There are 211 points between the high and low, now multiply 211 by what extension ratio you want to find. 211*1.272=268. Finally, to find the extension value subtract the product from the second point. 5852-268=5583 1.272 extension.

Now let's combine to see what we have so far. Retracements and extensions.

Hmm... Now we have two major price relationships at 5583 and 5562. Let's keep looking to see if we can sweeten the deal with projections.
Now remember that projections require three points. In this example we will be projecting other downside moves from the most recent high made on 6/26.
How convenient, the downside move from 6/8 to 6/15 looks very similar. Remember, we call this symmetry as well.

The projection tool is allowing us to essentially paste a previous move onto a current one with the hopes of being able to identify a useful point. In this example, a possible low.
To recap, we now have three price relationships aligning in a small area. The .618 retracement, the 1.272 extension, and symmetry from another recent down move.

Finally, we will zoom back on a longer time frame to identify other similar moves to see if we can project them towards the same area. The first decline was bout 260 points on the NQ_F so we will checkout moves with a similar range.
I scroll back and start measuring declines. Besides the most recent one made in June I can find two other ~260 point declines within about the last year of trading. I use my projection tool and now have three symmetric declines.
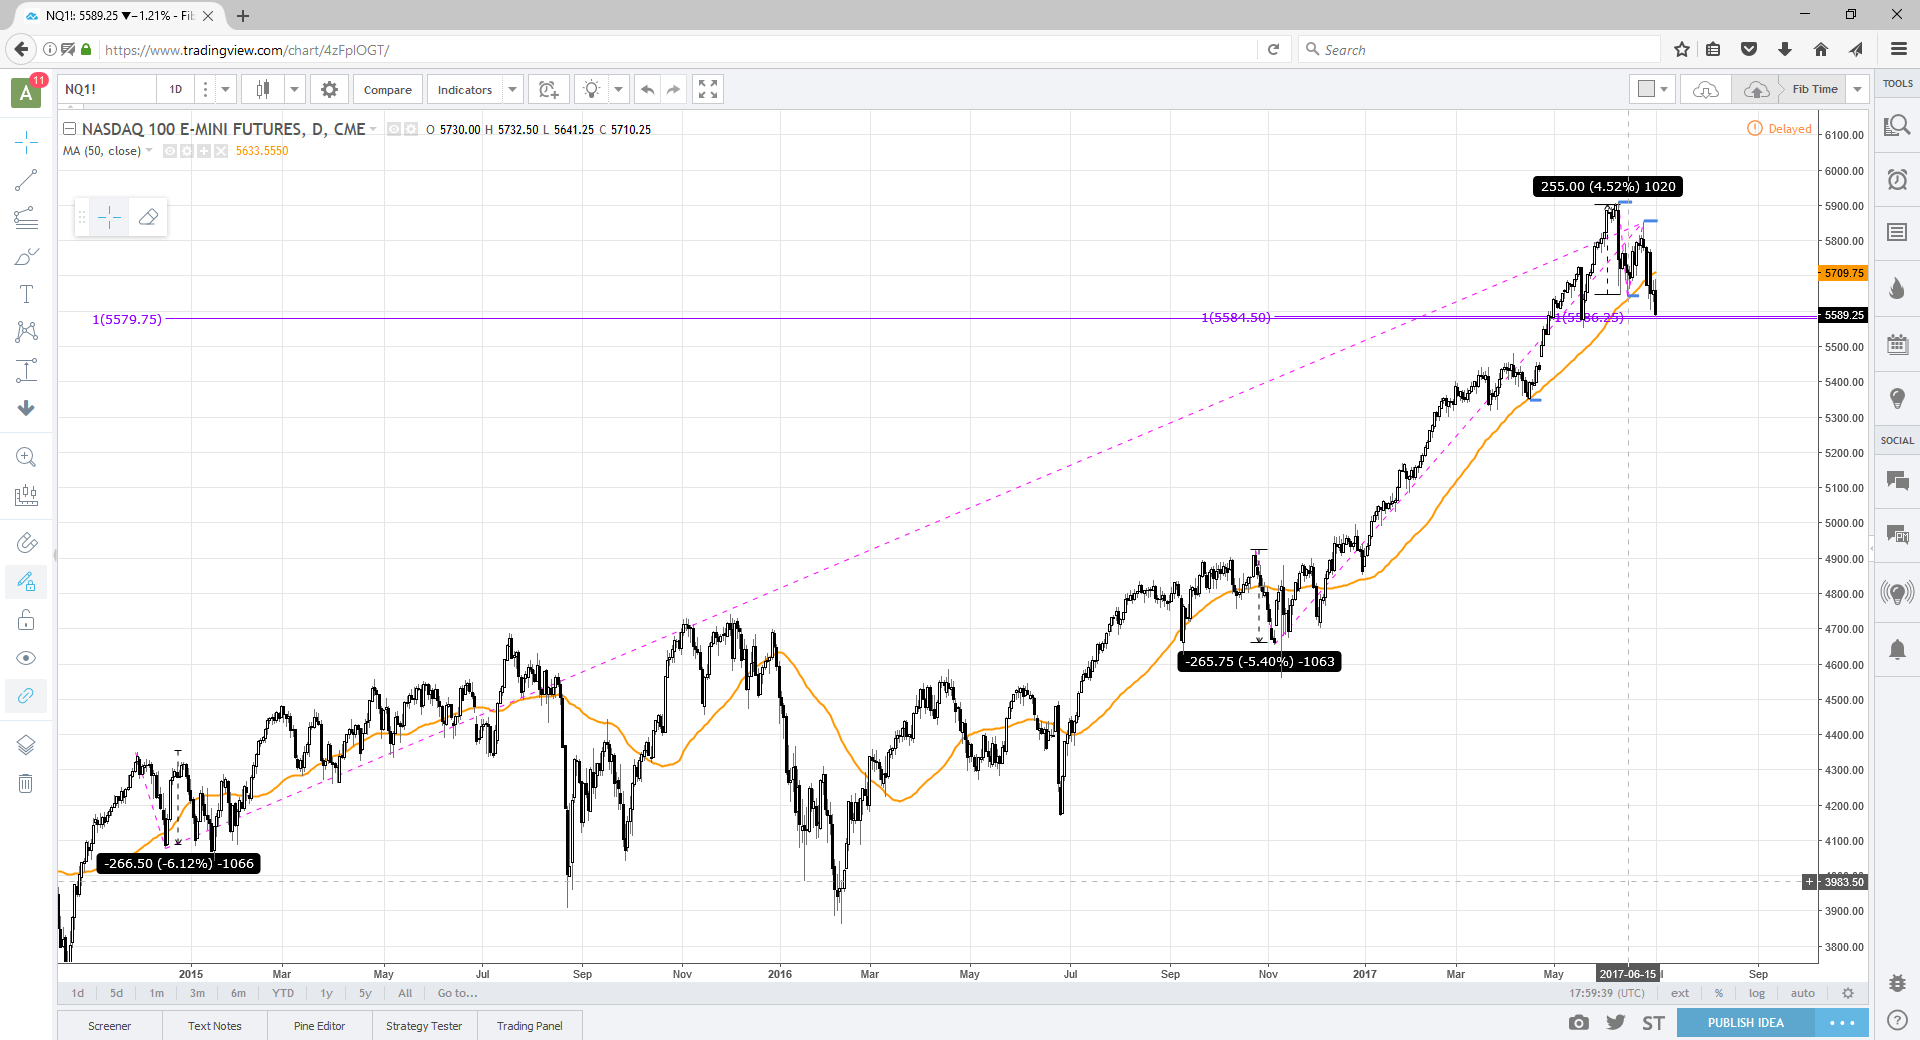
The last step is to finish the mosaic and add back the retracements and extensions. As you can see these relationships align in such a tight range that one can barely read the price labels. This type of confluence is called a cluster. They are very reliable and can be used to create winning trades.

I will be posting more in the future about how I use these clusters but wanted to write a more in depth post on how the cluster zones are created. I hope this was educational.
Upvotes & Resteems appreciated
TN Trader