📈 True Profitable Cryptocurrency Trading 💰 - [RESEARCH PT 3.]

Now in the 2nd Monte Carlo simulation I have actually included the Expectancy value too, since the Profit itself is misleading. We could have 1 big Profit with 1 Trade but it might be a Loss if we have multiple ones.
So the optimal strategy is definitely the one with the most trades and the most expectancy, hence the product of that which is the Profit. However, whereas the Profit is the secondary benchmark (since the System is actually researched by the LN Error), the Expectancy is what we use to determine our actual Profits:
Actual Profit = Position Size * Nr Trades * ExpectancySo good old Risk Management, it tells us that approximately 1% risk of our Capital is decent.
So if our Balance is 10,000$, then we trade with 100$, and with an expectancy of 0.01 (very good) we are supposed to make 1$ profit per trade. So in 100 trades,we would make 100$ profit, and have 10100$ in our Balance. Of course theoretically since as I said in the past article that Taxes & Fees should not be ignored.
Now to quantify the robustness of the strategy using the variance of the Expectancy is better.
Thus the 2nd Simulation yields:
- A
0.0002average expectancy per trade - A
0.0005standard deviation of the expectancy distribution - Thus a 31.9790% probability that we get a loser strategy instead of a 12.2433% which was indicated by the past simulation.
Now the 12.2433% was based on the previous simulation, normally this should be equal since if you multiply or divide a positive or negative number it should be the same sign, but note that in the 2nd simulation we included the micro-chunks too, so we get more trashy results this way.
Of course we could restrict that to only larger chunks and then we would probably get better results, but actually it’s not the Monte Carlo simulation that should be restricted but the filter itself.
So the Monte Carlo simulation has to run through all values, to quantify the variance and the robustness of the parameter.
But if we want more reliable values then we actually need to increase the initialization size, since that is set to about 10 datapoints now.
Maybe if we let the system have more room to initialize itself, then we will get more accurate results. Needs to be investigated.
And then of course the Monte Carlo simulation will have larger chunks too, since we can’t include chunks smaller than the minimum size needed for initialization.
I haven’t investigated this phenomena yet but, I am onto it.
Now to compare it to the previous Simulation:
| . | Sim1 | Sim2 |
|---|---|---|
| Average LN Error | 0.04664 | 0.04647 |
| STDEV LN Error | 0.011848 | 0.01289 |
| Average Profit | 0.01228 | 0.01203 |
| STDEV Profit | 0.010563 | 0.01064 |
So roughly we get the same distribution, but with including the smaller chunks in the 2nd one of course.
To compare the Expectancy to the Datasize and the Trade Count, see the following chart:
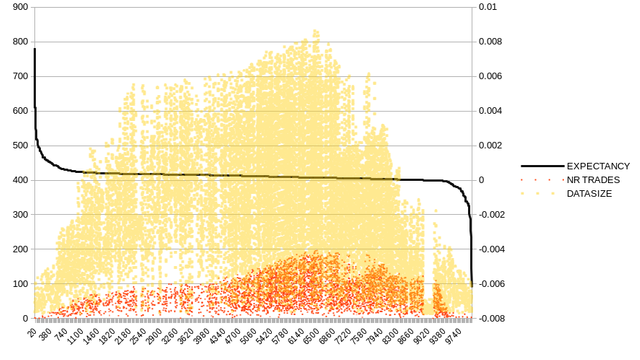
As you can see it’s actually not necessarily the event with the most trades or data that is the most expected to be profitable.
We get the most expectancy from the smallest amount of trades, then it starts shrinking.
But of course small amounts of trades are unreliable, since the sample size is tiny. So the most amount of profit is somewhere along the middle, probably around the >800 Datasize range.
So our previous conclusion is correct, the more data, the more profit, I just wanted to illustrate that big profit =/= big expectancy, since 1 lucky trade could have a better performance than 100 average trades, but of course the “lucky” trade is unreliable. Thus the Profit is the secondary benchmark after the LN Error.
But that doesn’t mean that the Expectancy is not a useful benchmark, it is, and it’s also necessary to know this.
So from the chart if we want to filter off most negative outcomes, we should have somewhere along at least 400 datapoints. But we can’t filter out this, however I will increase later the initialization size and see if that changes this outcome.
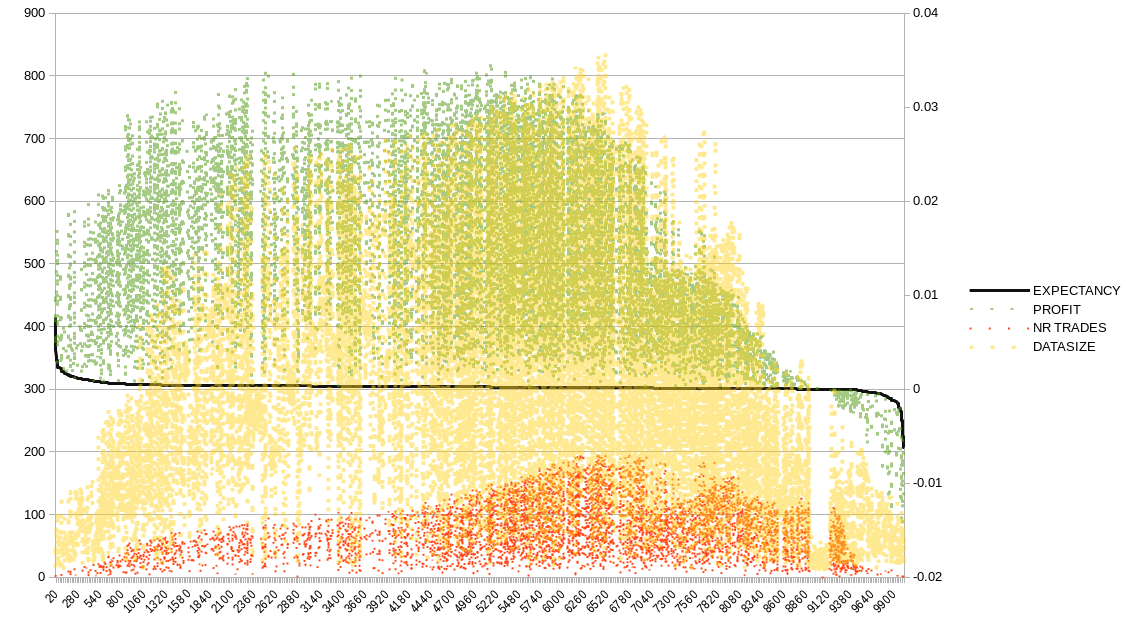
So the Profit actually overlaps the most trades or the largest dataset, so we can get larger profit from smaller trades too, but the intersection of that zone seems to be the most reliable:
Sources:
https://pixabay.com