Have Indian Stocks Just Started a Multi-Decade Bull Market?
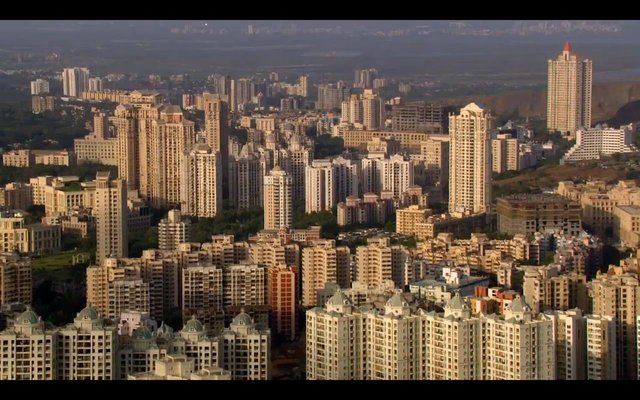
Mumbai Skyline, the Hiranandani Gardens Township in Powai, Mumbai, India. [Note A]
Personal Background and Why I Wrote This Report
This is my first contribution of content to Steemit. I hope Steemit becomes a big success. I work in Accounting/Finance in the United States. I believe the Indian economy is much more promising than most people imagine and I believe Indian stocks may be entering a multi-decade bull market. But this is not an objective report, because I’m biased in favor of Indian stocks since I recently invested in them. I am not an investment advisor, so please do your own research before investing any money. This report should give you a new perspective on the Indian economy and stock market.
Overview
Here are some quantitative factors showing the current strength of the Indian economy/stock market:
- India has the 3rd largest economy in the world on a purchasing power parity basis.
- India’s stock market has room to grow because it is only 37% of its GDP on a Purchasing Power Parity Basis.
- India has the 2nd highest labor force in the world and is expected to grow fueling economic growth.
- India is self-sufficient both in food production and economically.
There are also a variety of qualitative or cultural factors that show that the Indian economy and stock market have a bright future:
- India is a republic with freedom and the chaos that freedom brings (anti-fragility). Paradoxically, the chaos of freedom makes India a much more stable country. India has the rule of law. These factors are good for long-term investors.
- Education is very important in Indian culture. India is developing the intellectual capital valuable in the world economy.
- Due to scarcity of capital, creativity and innovation are used instead. This makes India lean and efficient.
Long-term investors may be able to make large sums of money when they invest in the Indian stock market as part of a well-diversified investment portfolio. This article will give you information so you can start your own analysis of the Indian economy and stock market.
India Has the Third Highest Gross Domestic Product in the World
The World Bank reports that India has the third largest Gross Domestic Product (GDP) in the world on a Purchasing Power Parity (PPP) Basis. PPP is used because the cost of living is higher or lower in different countries. PPP puts all countries on equal footing. Quantitative information such as GDP is presented only to provide a feel for the big picture. Perfect information does not exist. GDP and other economic figures are based on a mountain of assumptions. For example, if true inflation is higher than reported, then actual Gross Domestic Product would be lower than reported. These GDP figures are still useful for purposes of this report.
Gross Domestic Product 2015 by Purchasing Power Parity
| Ranking | Economy | In $ Trillions |
|---|---|---|
| 1 | China | 19.5 |
| 2 | United States | 17.9 |
| 3 | India | 7.9 |
| 4 | Japan | 4.7 |
| 5 | Germany | 3.8 |
| 6 | Russian Federation | 3.6 |
| 7 | Brazil | 3.2 |
| 8 | Indonesia | 2.8 |
| 9 | United Kingdom | 2.7 |
| 10 | France | 2.7 |
| 11 | Mexico | 2.2 |
| 12 | Italy | 2.2 |
| 13 | Korea, Republic | 1.7 |
Gross Domestic Product is an estimate of the total value of economic activity in a country. Purchasing Power Parity puts all GDP estimates on terms of the purchasing power of the US dollar in the US to equalize for higher or lower purchasing power in different economies.
Only the top 13 economies are shown on this chart. For all countries, see: http://data.worldbank.org/data-catalog/GDP-PPP-based-table for more information.
Even though India has the 3rd largest economy in the world, India’s ranking for stock market capitalization is much lower compared to other countries. The Visual Capitalist reports the following in All the World’s Stock Exchanges by Size:
Total Capitalization of Top Stock Exchanges in the World
| Country | Exchanges | In $ Trillions (Feb. 2016) |
|---|---|---|
| U.S. | NYSE & NASDAQ | 25.9 |
| China | Shanghai and Shenzhen | 7.9 |
| Japan | Japan Exchange Group | 4.9 |
| Euronext | various European with some London | 3.4 |
| United Kingdom | London Stock Exchange | 3.3 |
| Hong Kong | Hong Kong | 3.2 |
| India | BSE & National Stock Exchange | 2.9 |
| Germany | Deutsche Boerse | 1.7 |
| Canada | TMX Group | 1.7 |
Source: Visual Capitalist. See: http://www.visualcapitalist.com/all-of-the-worlds-stock-exchanges-by-size/
The next chart will show how stock market capitalization compares to Gross Domestic Product on a Purchasing Parity Basis.
Total Stock Market Capitalization as a Percentage of Gross Domestic Product on a PPP Basis
| Economy | Stock Market Capitalization (in $ Trillions) | GDP on PPP Basis (in $ Trillions) | Stock Market Capitalization/GDP |
|---|---|---|---|
| United States | 25.9 | 17.9 | 145 % |
| United Kingdom | 3.3 | 2.7 | 122 % |
| Japan | 4.9 | 4.7 | 104 % |
| Germany | 1.7 | 3.8 | 45 % |
| China | 7.9 | 19.5 | 41 % |
| India | 2.9 | 7.9 | 37 % |
This chart shows that although India has a major economy, its stock market capitalization is quite low. The US stock market capitalization represents 145% of its economy; whereas the Indian stock market represents only 37% of its economy. This low percentage could be due to a combination of factors including: The US and other stock markets are overvalued due to central bank purchases of debt or stock securities, the Indian stock market is undervalued, International institutional investors have not invested large sums in the Indian stock market, and Indian corporations obtain financing on foreign stock exchanges or from other non-stock market sources.
This low percentage suggests that the Indian stock market has room to grow. Germany and China also have low ratios, so the next question is which economy will grow the most in the next few decades? Working age population is a major driver of economic growth, which will be examined next.
India’s Rising Working Age Population = Economic Growth
India currently has the 2nd largest working age population in the world and has a favorable population growth rate.
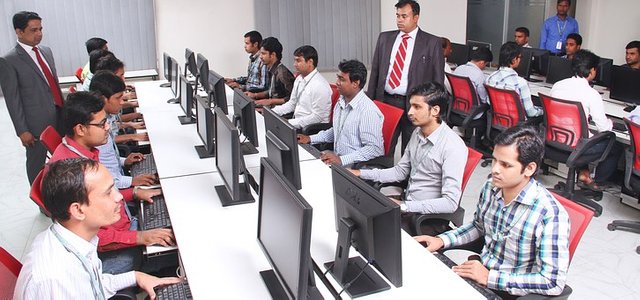
Office, Classroom, Computers, India [Note B]
In his book 1966 book Tragedy & Hope: A History of the World in Our Time, Carroll Quigley explained how a surge in working age population growth coincided with economic and national power as population growth shifted from Europe (England/France to Germany) then to the United States and finally (he predicted) to Asia. Current economic conditions in China and India suggest that Professor Quigley’s book written 50 years ago was quite prophetic.
The countries with the largest labor forces
| Country or Region | Labor Force (in Millions) |
|---|---|
| China | 798 |
| India | 187 |
| European Union (28 separate countries) | 229 |
| United States | 155 |
Source: en.wikipedia.org/wiki/List_of_countries_by_labour_force
Wikipedia shows that the countries with the highest population in 2016 are China with 1.38 billion, India with 1.33 billion, and the United States with 0.32 billion [Note 1]. China’s population growth rate from 1990 to 2010 was 17.1%; India’s rate was 40.2%; and the United States’ rate was 22.5% [Note 2]. China’s growth rate was stunted by the “one child policy” which in turn caused significantly more males to be born than females. This shows that both the US and India may have a higher economic growth rate than China in the future.
India Has Very Low External Debt
New debt can expand economic activity in an economy, whereas too much debt can hinder economic activity because income must be spent servicing debt. If debt is too high to be paid it will depress the economy because either the lender will lose purchasing power when the loan is not repaid or the borrower will lose purchasing power when income and assets are used to pay the lender. India has extremely low debt for an economy of India’s size. There is room to grow as the Indian debt markets and convertibility of the Rupee are developed over time.
External Debt per Capita and as a Percentage of Gross Domestic Product on a Purchasing Power Parity Basis for the Five Largest Economies
| Economy | External Debt in Billions | Date | External Debt per Capita | % of GDP (2015) on PPP Basis |
|---|---|---|---|---|
| China | $1,680 | June 30, 2015 | $ 1,195 | 8.6 % |
| United States | 17,911 | Mar. 31, 2016 | 60,340 | 99.80 % |
| India | 486 | July 2, 2016 | 46 | 6.08 % |
| Japan | 2,681 | Mar. 31, 2014 | 24,000 | 60.39 % |
| Germany | 5,547 | Mar. 31, 2014 | 68,720 | 144.14 % |
Source for first four columns: Wikipedia, List of Countries by External Debt,
https://en.wikipedia.org/wiki/List_of_countries_by_external_debt
Note that external debt only includes debt, it does not include actuarial liabilities, which are like the present value of what the country has promised for pensions etc. based on a number of assumptions projected into the future. For example the United States has unfunded actuarial liabilities for various programs, including Social Security and Medicare, in excess of $127 Trillion. Also note that even though these numbers are being revised constantly, it does not matter for our purposes, since we just need a general idea of the magnitude of external debt. This chart demonstrates that India has a miniscule amount of external debt and conversely has the capacity to expand external debt as debt markets are developed.
India Is Self-Sufficiency in Food Production
With the rising population, the next question is if India is self-sufficient in food production. A large percentage of the Indian population is engaged in agricultural production. There is sufficient land and water in India for increased food production in the future. [Note 3]
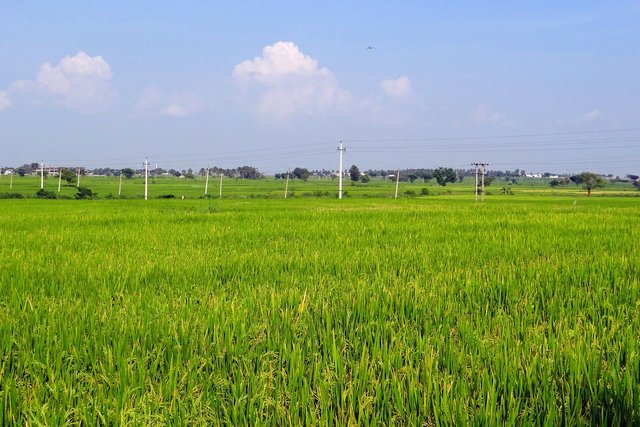
Rice Fields, Gangavati, Karnataka, India [Note C]
Indian Economy is Not Overly Dependent on Imports or Exports (It is self-sufficient)
Whereas the US has a (negative) trade balance and China has a positive trade balance, India has a small (negative) trade balance as shown on the following chart:
Trade Balances as a Percentage of Gross Domestic Product on a Purchasing Power Parity Basis in 2014 (Amounts in Billions of Dollars)
| Economy | Imports | Exports | Trade Balance | GDP on PPP Basis (2015) | Trade Balance/GDP |
|---|---|---|---|---|---|
| United States | 2,190 | 1,450 | (731) | 17,400 | -4.20 % |
| China | 1,530 | 2,370 | 834 | 19,500 | 4.28 % |
| India | 421 | 292 | (129) | 7,900 | 1.63 % |
With the exception of the “GDP on PPP Basis” column which came from the 2015 World Bank information cited earlier in the report, the following sources were used for this chart: http://atlas.media.mit.edu/en/profile/country/ind/ (for India). http://atlas.media.mit.edu/en/profile/country/usa/ (for United States). http://atlas.media.mit.edu/en/profile/country/chn/ (for China).
Cultural Emphasis on Education Helps India Participate in the World Economy
Because there are many different languages in India, both Hindi and English have emerged as universal languages in India. Many people in India know several languages. This makes the Indian population well suited for interaction in the global economy since English has become the international language for science and technology.
Bollywood and Other Global Entertainment
Hindi has become the base language for an India-based film/entertainment industry. Films are also made in other Indian languages as well as English. In 2011, over 3.5 million Bollywood tickets were sold across the globe compared to about 2.6 million Hollywood tickets. [Note 4]

Actress Rani Mukerji at 4th Annual asiaSpa India Awards, 2011 [Note D]
Creativity and Innovation
Capital has been scarce in India. This has forced Indian companies to substitute intelligence and creativity for capital. This has made Indian companies lean and efficient. An example of this is the Nano Gen X, a four door sedan manufactured by Tata Motors as shown below:
2014 Nano automobile by Tata Motors [Note E]
The Nano Gen X was designed from scratch. Instead taking a more expensive car and stripping away features, the Nano automobile was engineered from scratch to provide the features people want at a very low cost. Its fuel efficiency is 23.6 Km/l (or 55 miles/gallon) for manual or 21.9 Km/l (or 51 miles/gal) for automatic transmission. Its top speed is 105 Km/hr (or 65 miles/hr). It has air conditioning, electric powered steering, 110 L luggage space, 24 L fuel tank, front power window. Safety features include additional body reinforcements, seat belts, impact cushioning crumple zones, side intrusion beams, etc. With all these features, the Nano Gen X 4-door sedans sell for 206,000 to 303,000 Rupees (or $3,081 to $4,532).
The ability of Indian companies to provide innovative low-cost products can open up international markets in countries that want low-cost products.
The Chaos of Freedom Makes India a More Stable Country
India is a republic with a parliamentary system with power distributed between the federal government and the states. There is rule of law in India. The court system may be slow, but it works. India has the “chaos” associated with people expressing their view and practicing freedom. In India, conformity to socially acceptable behavioral norms may be expected, but freedom of thought/belief is highly valued. As a result, India can more easily adapt to the modern economy where knowledge and thinking skills are more important. In his book Anti-Fragility, Nassim Nicholas Taleb explains how an entity that is anti-fragile actually gets stronger due to stress and shocks, whereas a fragile entity can suddenly collapse due to stress and shocks. A free country like India has more “anti-fragility” because freedom allows for the release and resolution of dissatisfactions. Whereas in a dictatorship or oligarchy dissatisfactions are bottled up until they suddenly explode and completely change the system. Freedom also fosters innovation in science, technology and social aspects of life.
New Simplified Goods and Services (Value Added) Tax Will Boost the Economy
India has recently approved a Goods and Services Tax, a national value added tax that will replace a collection of separate taxes issued by the central and state governments effective April 1, 2017. [Note 5] This simplified new tax is expected to boost the Indian economy by reducing the overall tax burden on residents and reducing the administrative burden of compliance with multiple tax structures.
Janmarg BRTS – an Example of a World Class Public Transportation System
The Janmarg BRTS (Bus Rapid Transit System) in Ahmedabad, which is a city of about 6 million people covering 466 square kilometers, is another example of the progress being made in India. This is a 10-minute video that shows how this city’s transportation infrastructure was completely transformed. I highly recommend watching this video:
Source: YouTube.com [Note F]
State and local governments and private entities cooperated to do the following:
- Converted 65,000 auto rickshaws to compressed natural gas (CNG) from 2005 to 2010.
- Converted old diesel buses to new CNG buses and increased number of buses from 560 to 1010 in just four years.
- Created 2-way central lanes dedicated to buses.
- Built overpasses and underpasses and river bridges.
- Built state of the art bus stations with smart cards.
- Designed the system to cover the transportation needs of all residents regardless of income. It passes through 80% of low and middle income areas.
- CEPT University created a new Master’s Degree in Urban Transportation Planning and Management.
- Information Technology infrastructure including GPS tracking of buses, RFID alignment of buses at raised bus station loading/unloading areas, and visual and verbal announcement.
- Low cost bus fares (only 3 rupees which is equivalent to 4.5 cents).
- Only 2.5 minutes between buses during peak travel times.
Results included a 52% modal shift from private vehicles to public transportation. The Janmarg BRTS has daily ridership of about 130,000 people. Independent surveys show 90% customer satisfaction.
India Has the Seventh Largest Navy in the World (Helpful for International Trade)
India has the seventh largest navy in the world in terms of tonnage after the United States, Russia, China, Japan, the United Kingdom, and France. The Indian Navy has about 100,000 personnel. Having a strong navy is important for national defense and the protection of maritime assets used in international trade.
India Has Its Share of Negatives
- Risk of tensions with Pakistan and China (being reduced)
- Bureaucratic rules and regulations
- Corruption in government (being reduced)
- Ignorance and illiteracy (being reduced)
- Poverty and insufficient capital (being reduced)
- Dependence on imported oil/natural gas (Low oil prices are currently helping India. Falling prices for solar power cells should help as well.)
Why invest in the Indian Stock Market?
*There is a sense of optimism in India and a feeling that they can create a better future.
- This is a long-term opportunity. It might be like investing in the USA in 1905.
- There is the potential for India to expand the export of goods and services in the future.
- Indian stocks provide excellent diversification for international investors because India has a large economy that is internally focused. Indian stock market returns for smaller cap companies should be negatively correlated to US, European, Chinese and Japanese stocks.
- Indian entrepreneurs, chief executive officers and venture capitalists in Silicon Valley and various foreign countries provide an example of what can be done.
- Institutional money managers are starting to recognize India (For example BlackRock recently started some Exchange Traded Funds (ETFs) for Indian stocks.)
Key Ratios on Indian Stock ETFs
ETFs are recommended rather than individual stocks because they provide diversification within the Indian stock market. Here are the key ratios of ETFs holding large cap, medium cap and small cap Indian stocks:
| ETF Symbol -------> | INDA | PIN | EPI | SCIF | SMIN | INCO |
|---|---|---|---|---|---|---|
| Expense ratio | .68 | .85 | .83 | .89 | .74 | .89 |
| Market cap of portfolio | giant | giant | large | small | medium | large |
| Price/projected earnings | 19.62 | 17.43 | 14.94 | 12.06 | 17.06 | 27.21 |
| Price/projected book value | 2.93 | 2.46 | 1.75 | 1.16 | 1.87 | 6.30 |
| Price/projected sales | 2.11 | 1.72 | 1.44 | .72 | 1.09 | 2.04 |
| Price/projected cash flow | 8.01 | 5.58 | 5.44 | 2.59 | 5.86 | 20.76 |
| Dividend yield projected | 1.96% | 2.43% | 2.40% | 1.43% | 1.38% | 1.21% |
| Cash flow growth | 6.71% | 10.52% | 5.03% | -2.85% | -7.74 | 2.50% |
| Portfolio turnover | 30% | 68% | 38% | 40% | 73% | 47% |
| Beta, market = 1 | .82 | .82 | 1.01 | 1.31 | 1.07 | .87 |
| Alpha | 12.65 | 11.97 | 15.33 | 24.79 | 29.19 | 21.81 |
| Current price | 29.45 | 20.57 | 21.62 | 46.14 | 36.20 | 36.05 |
| Net Asset Value | 29.42 | 20.64 | 21.72 | 46.58 | 36.07 | 35.96 |
| Premium (Discount) | -.14% | -.34% | -.88% | ** -.33%** | .30% | -.28% |
Source: Morningstar.com (data at September 16, 2016)
Analysis of ETF Ratios and Investment Strategy to Consider
- It is good to hold a well-diversified investment portfolio. An allocation of about 21% to the Indian stock market would be wise for participating in the potential gain while minimizing risk by having adequate diversification.
- It would be good to combination of Indian stock ETFs specializing in giant/large cap stocks, medium cap stocks and small stocks.
- Note that INDA currently has the lowest expense ratio.
- Note that SCIF and EPI have favorable price/projected earnings ratios.
- SCIF’s low price/projected book value and price/projected sales ratios show that it is value oriented.
- SCIF has the best price/projected cash flow ratio. The rest have decent price/projected cash flow ratios, except for INCO which is focused on consumer product companies. Even a price/projected cash flow of 6 is excellent because it shows that the underlying companies provide enough cash to return invested cash in 6 years for a return of about 17%/year (if other factors are ignored).
- PIN and EPI have the best projected dividend yields.
- PIN has the best actual cash flow growth in the past, but INDA and EPI have reasonable cash flow growth figures.
- INDA has the lowest portfolio turnover, which is favorable.
These ratios look good and seem to show that they are reasonably priced.
Conclusion
No one can know the future, but based on India’s current existing economic strength, relatively low stock market capitalization, rising working age population, intellectual capital, good governance, and an overall sense of creative energy, I believe that the Indian stock market is ready for a multi-decade bull market. The Key ratios show that Indian stocks on average seem to have a favorable price level for investors with a long-range perspective.
Notes/Sources
Note A – Photograph entitled “Mumbai Skyline, the Hiranandani Gardens Township in Powai, Mumbai, India” was created by Deepak Gupta, November 2008. Original image is located at https://www.flickr.com/photos/76932422@N00/3600178660/. Used Creative Commons license CC BY-SA 2.0 found at https://creativecommons.org/licenses/by-sa/2.0/legalcode.
Note B – Photograph entitled “Office, Classroom, Computers” was created by Selena Jain. Original image is located at https://pixabay.com/en/users/selenajain-470247/?tab=latest. Used Creative Commons license CC0 1.0 Public Domain Dedication found at https://creativecommons.org/publicdomain/zero/1.0/deed.en
Note C – Photograph entitled “Rice Fields, Gangavati, Karnataka, India Paddy” was created by Bishnu Sarangi. Used Creative Commons license CC0 1.0 Public Domain Dedication found at https://creativecommons.org/publicdomain/zero/1.0/deed.en
Note D – Photograph entitled “Rani Mukerji at 4th Annual AsiaSPA India Awards” was created by www.filmitadka.in on 14 April 2011. Original image is located at http://www.filmitadka.in/page3-parties/asiaspa-awards/rani-mukherjee-17769.html. Used Creative Commons license BY-SA/3.0 found at https://creativecommons.org/licenses/by-sa/3.0/legalcode
Note E – Photograph entitled “2014 Tata Nano” was created by Nadir Hashmi. Original image is located at https://www.flickr.com/photos/nadircruise/page7. Used Creative Commons license BY-NC-ND/2.0 found at https://creativecommons.org/licenses/by-nc-nd/2.0/legalcode.
Note F – YouTube Video entitled “A film on Ahmedabad's Janmarg BRTS” was created by Official YouTube channel of Shri Narendra Modi, Prime Minister of India. Used in accordance with guidance provided at https://sites.google.com/site/amslerclassroom/using-an-embed-gadget
Note 1 - Wikipedia, List of countries and dependencies by population: https://en.wikipedia.org/wiki/List_of_countries_and_dependencies_by_population
Note 2 - Wikipedia, Population Growth: https://en.wikipedia.org/wiki/Population_growth
Note 3 - IOPScience, Spatial decoupling of agricultural production and consumption: quantifying dependences of countries on food imports due to domestic land and water constraints:
http://iopscience.iop.org/article/10.1088/1748-9326/8/1/014046;jsessionid=1E23F1CDBE33298E1C2B3CB7E63B3987.c6.iopscience.cld.iop.org#erl452631s3
Note 4 - Wikipedia, Bollywood: https://en.wikipedia.org/wiki/Bollywood
Note 5 - Wikipedia, Goods and Services Tax Bill: https://en.wikipedia.org/wiki/Goods_and_Services_Tax_Bill
interesting post~
keep steemin~! :)
@optimist ...good information about India economy in relation to other top countries of the world. Thank you for being optimistic about India...
Congratulations @optimist! You received a personal award!
You can view your badges on your Steem Board and compare to others on the Steem Ranking
Vote for @Steemitboard as a witness to get one more award and increased upvotes!