Market update April 2018
Market update: I'll try my best to dumb this down but I can't promise I'll be good at it.
Today, there was another 600 point drop in the DJIA today before settling down to -424. The stock market keeps hitting resistance walls and dropping back down again.
It's the result of really just one thing. The yield curve between the 10 Year US bond and the 30 Year US bond is flattening. Everything else is just a symptom.
Think of it from a risk perspective. If you are buying a 30 year bond, you probably want a higher interest rate than the 10 year bond because you are holding it for a longer period.
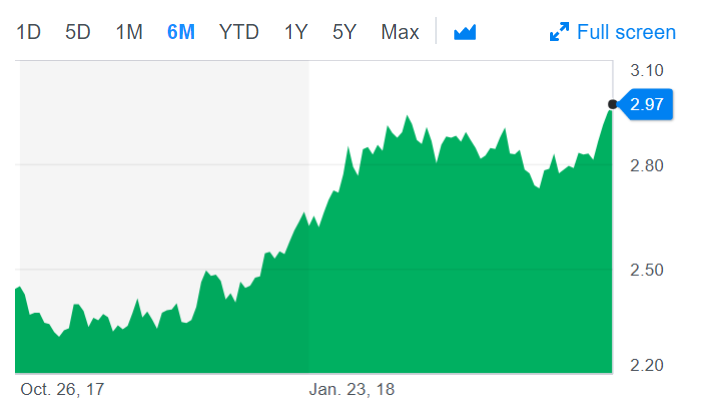
Thus if the 10 year rate (2.97) is higher than the 30 year rate (3.13%), something is not working. This situation is called an inverted yield curve. We aren't there yet, but we are getting close as the curve flattens.
The last time there was an inverted yield curve under similar conditions, it was the financial crisis of 2008. Within a year of the inverted curve taking place, the crash happened.
The 2008 financial crisis has never been rescued and was simply converted into a giant bond bubble which is experiencing stress fractures as interest rates rise to limit inflation after being artificially suppressed for nearly a decade.
Obviously there's a lot more to it, but I just wanted to suggest to everyone where to look for danger signs. There are a lot of talking heads, (me included sometimes) that spew a lot of hot air about what is causing financial issues. At this time, to cut through all the noise... a focus on the bond market will provide a decent compass as to what's happening.
US 10 YR