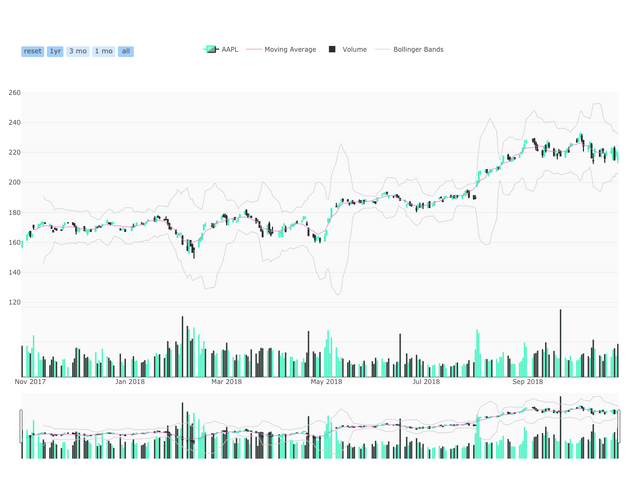
Apple Inc. (AAPL) Stock Analysis
Apple Inc.(AAPL)

Company Description
Apple Inc. designs, manufactures, and markets mobile communication and media devices, and personal computers to consumers, and small and mid-sized businesses; and education, enterprise, and government customers worldwide. The company also sells related software, services, accessories, networking solutions, and third-party digital content and applications. It offers iPhone, a line of smartphones; iPad, a line of multi-purpose tablets; and Mac, a line of desktop and portable personal computers, as well as iOS, macOS, watchOS, and tvOS operating systems. The company also provides iWork, a productivity suite that helps users create, present, and publish documents, presentations, and spreadsheets; and other application software, such as Final Cut Pro, Logic Pro X, and FileMaker Pro. In addition, it offers Apple TV that connects to consumers' TV and enables them to access digital content directly for streaming high definition video, playing music and games, and viewing photos; Apple Watch, a personal electronic device; and iPod touch, a digital music and media player. Further, the company sells Apple-branded and third-party accessories, such as headphones, displays, storage devices, Beats products, and other connectivity and computing products and supplies. Additionally, it offers iCloud, a cloud service that stores music, photos, contacts, calendars, mail, documents, and others; AppleCare support services; and Apple Pay, a cashless payment service. The company sells and delivers digital content and applications through the iTunes Store, App Store, Mac App Store, TV App Store, iBooks Store, and Apple Music. It also sells its products through its retail and online stores, and direct sales force; and third-party cellular network carriers, wholesalers, retailers, and value-added resellers. Apple Inc. has a strategic partnership with Salesforce to develop customer relationship management platform. The company was founded in 1977 and is headquartered in Cupertino, California.
| Valuation Metrics | Apple Inc. |
|---|---|
| Price | $216.3 |
| Daily Range | 0.19% |
| Opening Price | $215.90 |
| Daily Price Range | $212.67 - 220.19 |
| Bid | 217.00 x 1200 |
| Ask | 217.10 x 800 |
| Fifty-Two Week Range | $150.24 - 233.47 |
| Trading Volume | 43,091,514 |
| Average Trading Volume | 32,944,696 |
| Market Capitalization | 1.045T |
| Beta | 1.27 |
| P/E Ratio (TTM) | 19.60 |
| EPS (TTM) | 11.04 |
| Earnings Date | Nov 1, 2018 |
| Forward Dividend & Yield | 2.92 (1.33%) |
| Ex-Dividend Date | 2018-08-10 |
| Target Price | $239.63 |
| Sharpe Ratio | 1.01 |
Summary Statement:
Apple Inc. currently trades at a spot price of $216.3 with a one-year expected target price of $239.63 meaning an expected forward return over the next year of 10.79%. Some important measures to look at is the company's beta of 1.27 the company's Sharpe ratio of 1.01.