Tried and True Trading Techniques - Part 1
This post is a first in a couple of ways - my first post on Steemit and the first of many in a series that will explain the essentials of trading the financial markets. Posts that will get right to the core of what should and shouldn't be done when your trading any of the markets. You'd be surprised at how many "experienced" traders, and I mean with many years of experience, don't get the stuff that I'll be covering.
Let's get started by taking a look at this short list:
1 - Type of Market
2 - Mechanics of Trading
3 - Manual or Automated Trading
4 - Broker and Platform
5 - Schedule
This post is really all about the fifth item on the list, the schedule part. I'll briefly cover the first four parts before we get going. The first choice to make before actually trading is to decide which market you're going to trade. We're talking Forex, Futures, Stocks, Options ... you get the picture. Then it comes down to selecting a currency pair if you're going the Forex route. Or a commodity or an index if you're trading futures. Stocks? OK, which company? Obviously, all decisions to be made ahead of time.
The second item on the list, the mechanics of trading, is a name for all the knowledge you should have of how to place orders and what happens when you do. How to actually "trade", know what I mean? This information is essential. You should understand the types of orders you can place and how they're executed. The differences between a market and limit order type of thing. Most brokers will provide links to sections of their own sites or someone else's that will cover this. Dig up the rest of the terms you're not familiar with your fav search engine. When I write these posts, I'm assuming the reader will have a working understanding of trading basics.
Now for number three. Manual or automated trading. If you're going to be sitting there and watching the screen, waiting for the right moment to make your move, then you'll be manually trading. Most of the techniques/methods I'll be covering are for manual trading. If you're letting a computer program trade for you, that's automated trading, otherwise known as algorithmic trading. There's also semi-automated trading, which is a combo. I might cover more of this in another post.
4th. Choose your broker carefully. Experienced traders don't have to hear that. Any broker will have a limited number of platform options. Research and try out demo accounts with a number of different brokers. Stick with the one(s) that are, seemingly, the most honest and fill your orders the best.
Time to get to the point. Time to talk about your trading schedule.
After getting all set with the first four things on the list, it's time to really think about which markets you'll be watching AT WHAT TIMES. Trading is all about timing. Don't let anyone tell you otherwise. I've always laughed at this one: "It's not about timing the market, it's about time in the market." Sure. Tell that to someone going long and the market suddenly tanks, never returning to entry price. Or to someone shorting it and the market suddenly rallies. These situations happen all the time, and they can be dealt with properly. No problem. Just don't start thinking that if you stay in long enough, it will turn around and you'll be in the profit zone. Might never happen. Bottom line - if you want to trade profitably, work on your timing. We'll see how your schedule works into this.
Let's look at two different types of market conditions: trending and consolidating. This picture shows a trending EURUSD market.
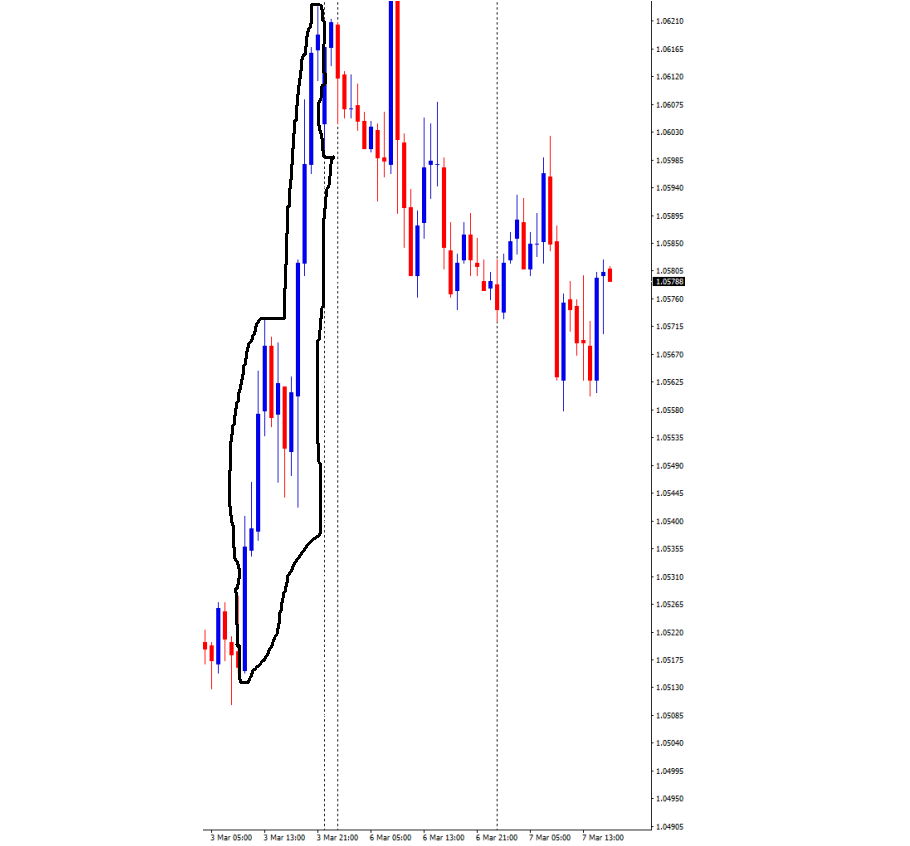
On 3-3-2017, between 10:00 and 21:00, prices ranged from 1.05153 to 1.06233. Over 100 pips in 11 hours - not bad for EURUSD. Take a look at the same market just before the trend started.
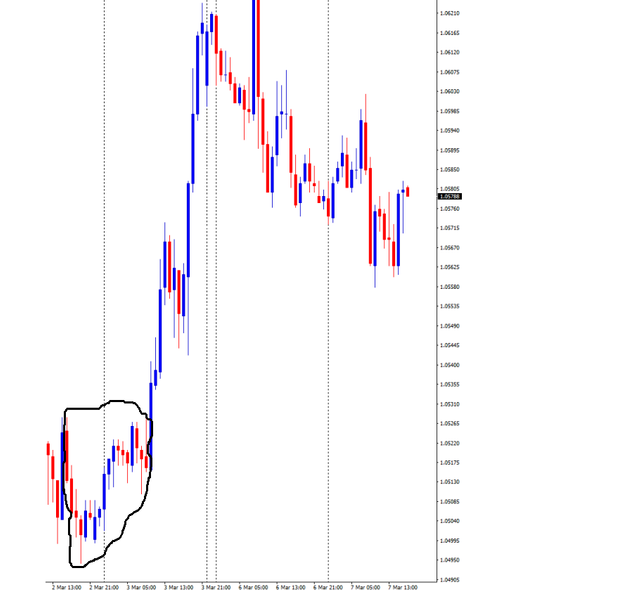
This is 3-2-2017 16:00, to 3-3-2017 9:00. The bid only ranged between 1.05278 and 1.04943 (33.5 pips) over 17 hours. That's an
example of a market in "consolidation". Here are a couple of links so you can see the definitions: http://www.investopedia.com/terms/c/consolidation.asp
http://www.investopedia.com/terms/t/trend.asp
One thing that's smart to have as part of your trading plan is a profit goal. It doesn't have to be set in stone. Just see how many points, pips, or ticks you'd be ready close at. Some people use a scalping strategy and are happy with one point. Others like to leave their positions open for longer and only close when they have a much bigger profit. Once you've decided how large your profit goal will be, taking into account the volumes (and commissions, and spreads) that you'll be trading with, you'll know how many ticks (or pips, or points) away from your entry price you'll be able to close your position at. In other words, you'll know your "profit distance".
Here's an example using EURUSD again:
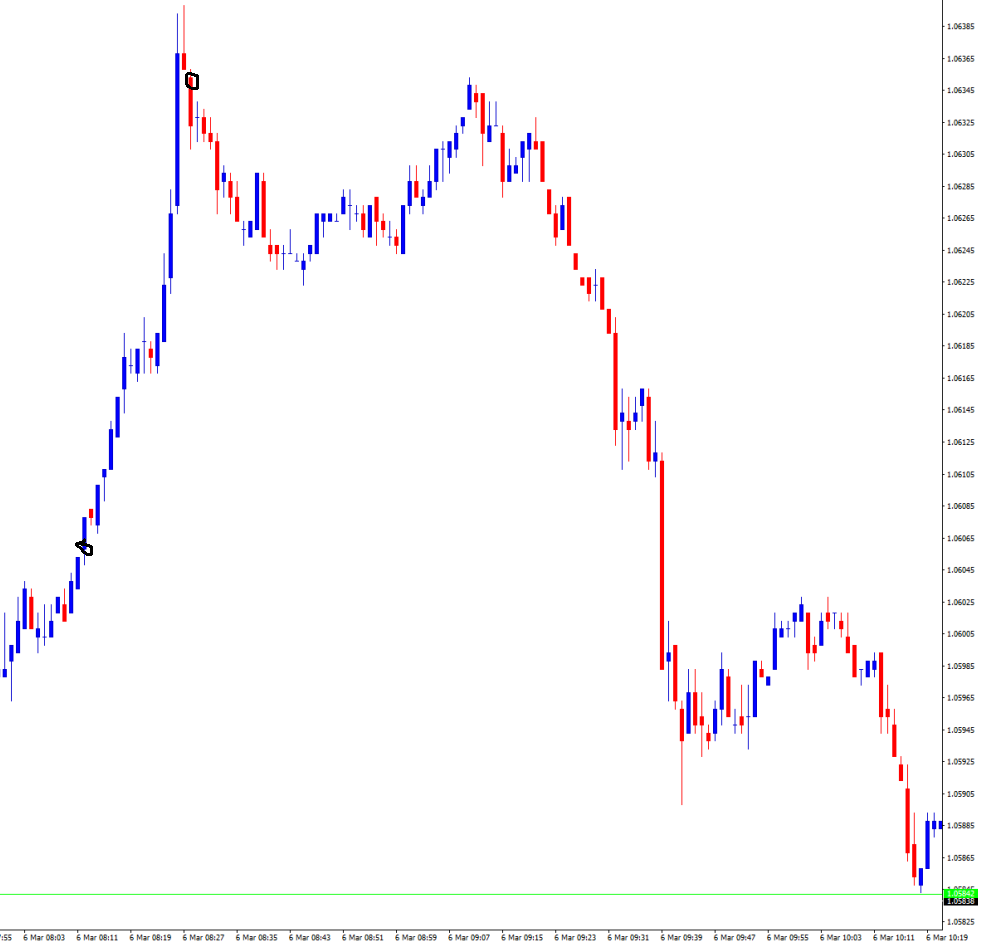
Opened a long position at 1.06058, 8:12. Closed that position at 1.06353, 8:28. That's a profit distance of 29.5 pips.
Knowing what your goal is in terms of a profit distance will give you an idea of how long you typically will have to leave a position open in order to reach that goal. But again, hey, nothing is set in stone with that, either. There are plenty of markets that jump 100 or more ticks in a matter of minutes or even seconds. What you have to do is check out the price charts for the markets you trade. I like the minute and hourly charts. Look at the charts during the times you have scheduled for watching the market(s) over the past weeks. Ask yourself: how long does it typically take, during the specific time of day that I'm watching the market, for prices to move through the profit distance of my goal? This is where correct scheduling of your trading time comes in. And just as importantly, ask yourself: will I be able to watch the market uninterruptedly between entry time and reaching my profit goal?
Let's look at a few examples dealing with the U.S. GOLD CFD and the EURUSD forex pair. Here are their charts shown in the 4 hour time frame, GMT.
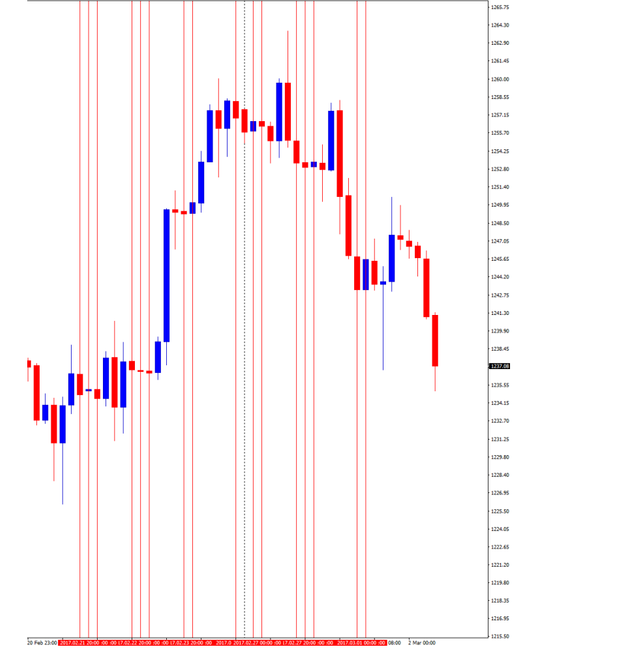
Looking at the 20:00, the 0:00, and the 4:00 bars (yeah, I know, candles) which are partially marked off, you can see that each of these 4-hour stretches GENERALY have the narrowest price range. In other words, the smallest difference between the high and low prices is often found during this 12-hour time period for both of these markets. There are plenty of days where this isn't the case, but usually, if there's going to be a period of consolidation, it can be found during these times. Also, it doesn't mean that consolidation can't be found at other times of the day. Of the two, the EURUSD is less consistent in having these consolidation periods. It's more of an "anything can happen at any time" pair. Study the charts for whatever markets you trade and you'll see similar typically slower and faster periods during the day.
Saying a market is in consolidation or is moving sideways is a matter of opinion because relative to your profit goals (which would tend to be on the small side in this case), the market could be trending "enough". A long-term trader with a large profit goal could say that prices are currently bouncing around in a narrow range. What's narrow? A scalper could say that things are rolling along fine. Relative, see?
Now check out this recent 1-minute gold cfd chart showing the time period from approx. 21:10 - 23:40 GMT on 2-28-2017.
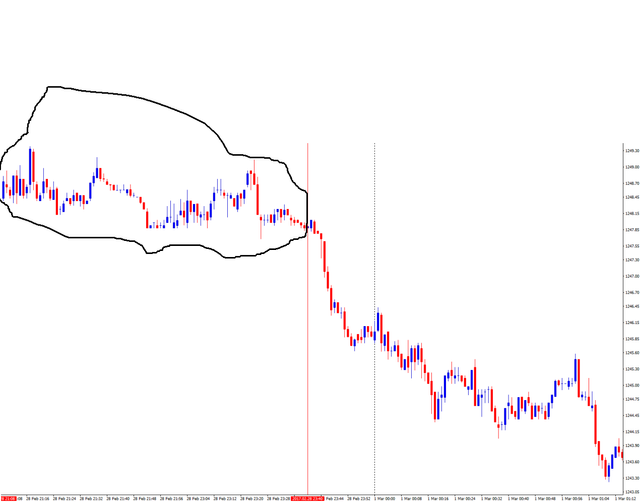
The highest bid during this time was 1249.38 and the lowest was 1247.68. Approx. 17 pips. Let's say that you were looking for an 8 pip profit and you got in short sometime during the first half of the chart. Say at the opening of the 21:38 candle (1248.98), shown here.
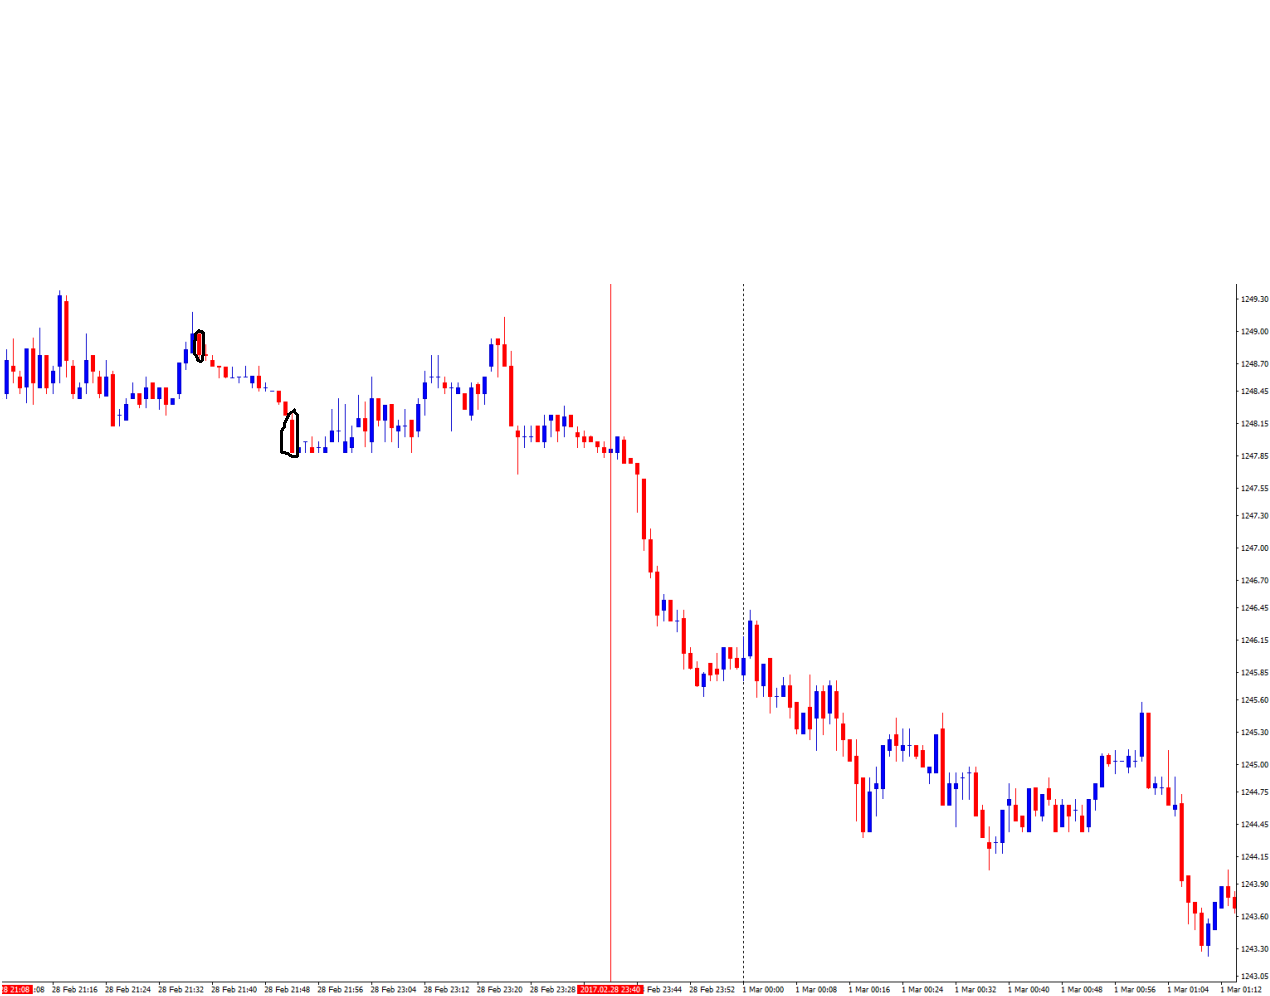
If the spread was 2 pips when taking profit, the price would have to drop a total of 10 pips to reach the goal (1247.98 on the bid and 1248.18 on the ask). It would have been a good entry because prices didn't retrace upward from that point. And, it wouldn't have taken long for the bid to reach 1247.98 - 14 minutes later at 21:52. Basically, a perfectly timed short-term trade. (I'm not going to go into the details of WHY you might want to get in at the specific prices mentioned in these examples.
That's another topic for another post. All that I'll say now is that I use a chart-based technical style).
If you got in a little later it would have been a different story.

If you would have gone short at the open of 21:48, your entry price would have been 1248.48 and your profit target of 8 pips would have the ask price set at 1247.68. Again, with a spread of 2 pips, the bid would obviously be 1247.48. Prices don't get that low until 23:44 - a wait of almost 2 hours for an 8 pip profit. That's consolidation, especially for this market. The fact that the bid retraced 6.5 pips upward past entry (23:24) isn't so great when you're only looking at making 8. These are typical situations that come up when trading during consolidation.
If we look at the same market about an hour and a half later, things are moving a little faster.
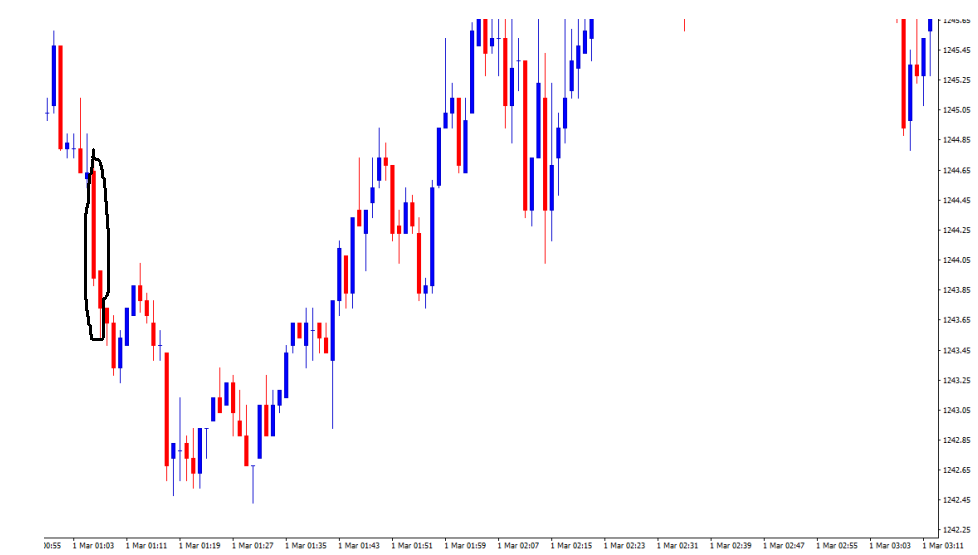
A similar short entry at 1:06, that's 1244.64 on the bid, would set a profit target at 1243.64 on the bid, 1243.84 on the ask
(again, 8 pips). The profit was hit at the next candle, 1:07. Not too long of a wait. The point is, when a market is trending you can reach a small profit goal very quickly (as long as you choose the right direction), and that same profit goal could take hours to reach when the market is in consolidation.
Time to look at a longer term trading example. We'll compare two different entries in EURUSD, one during consolidation and the other during a trend. Check out this EURUSD 1-min chart for 2-23-2017.
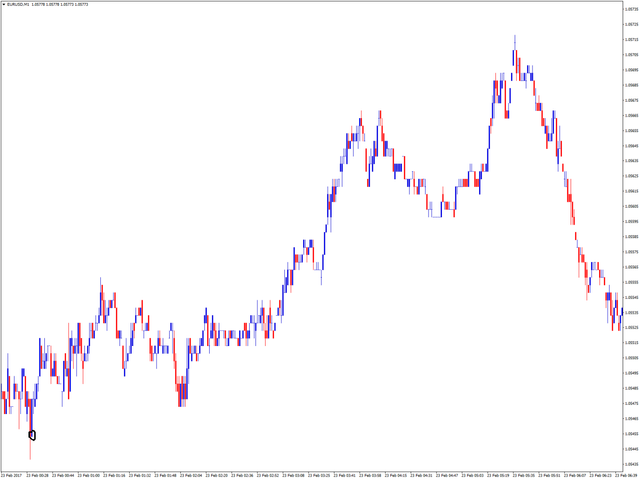
For the first entry, the one during consolidation, we'll go long at 1.05463 during the 0:31 candle opening (1 pip spread). The profit target will be 60 pips away with a bid of 1.06063. This was hit at 11:55 the next day - it took about 35 hours and
24 minutes to reach the goal.
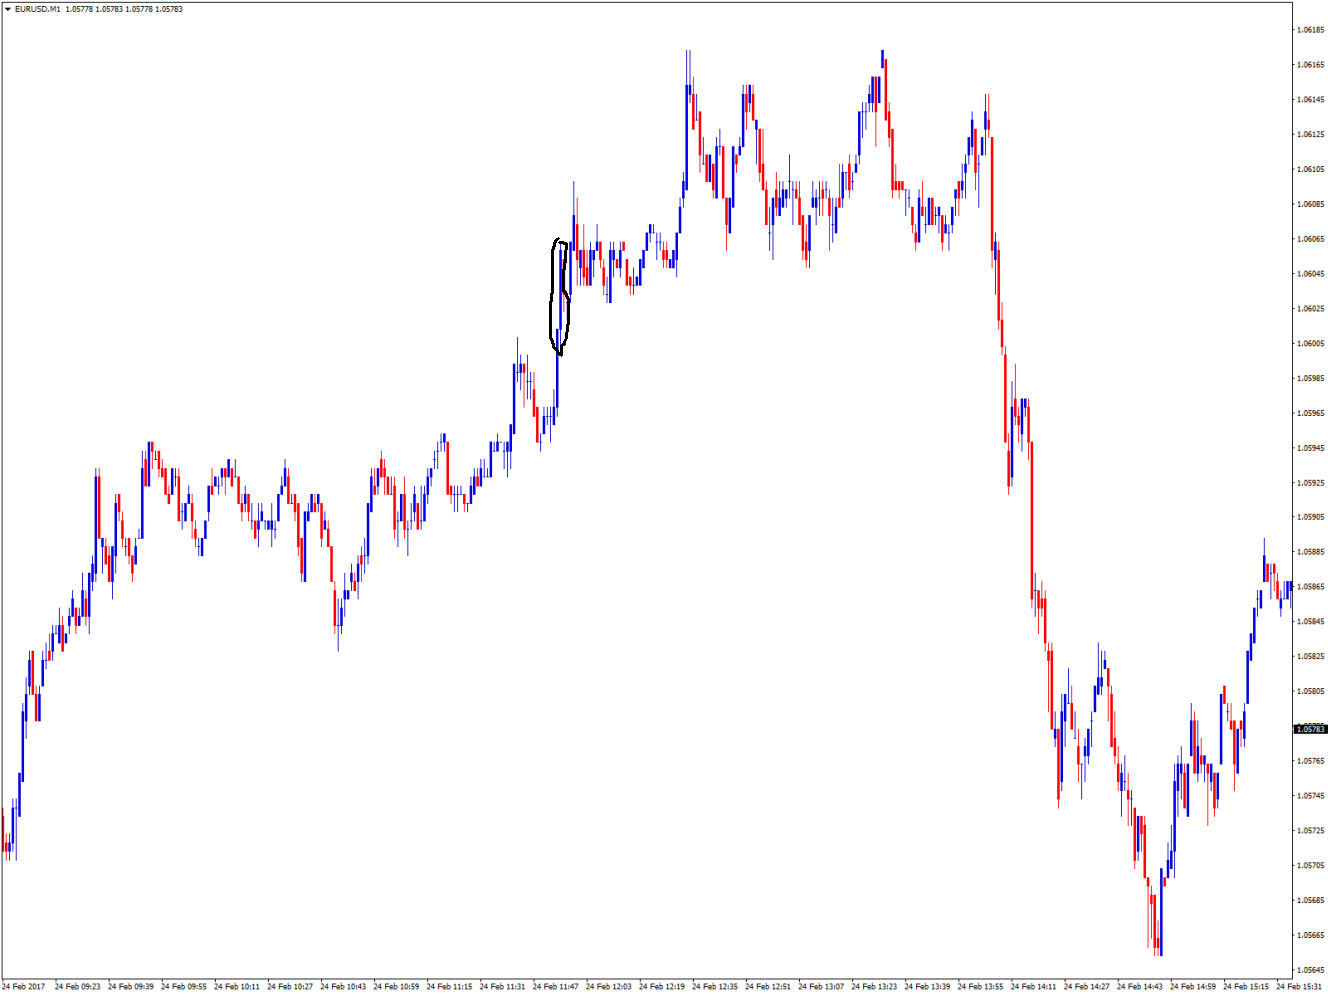
The worst price drop occurred at 10:09 with the bid at 1.05373. For the second entry, the one occurring later on when the EURUSD is trending upward, we'll go long at the same bid of 1.05463, at the close of the 11:25 candle on the 23rd.
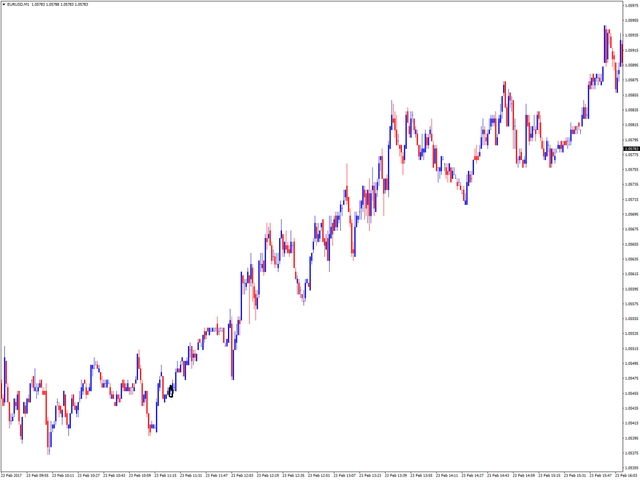
The take profit bid will be the same, 1.06063 at 11:55 the next day. This time it took 24.5 hours to exit - about 11 hours less.

The whole point of looking at these examples is realizing what kinds of decisions a trader has to make when he or she has to walk away from the screen and the profit target hasn't been reached yet. Do you leave your stop-loss where it is, or adjust it? How about your take profit, if you're using one? I always recommend using tight stops. Usually 1-3 pips or ticks plus the spread. If the spread is 2 pips as it is in these examples, your total loss would be between 3-5 pips. Take commissions into account if they apply.
In the first gold cfd example, say you used a stop-loss of 2 pips and a take profit of 8 pips as was shown. The stop would never have been hit, you could have walked away from the screen right after placing the pending orders, and you would have closed with a profit 14 minutes later. No problem. On the other hand, in the second example, if you would have used a 2 pip stop-loss, you would have been stopped out before your profit target was hit. Not being there to get back in the market will just leave you with a net loss and wasted time. It's the same thing with longer term trades. If you have to walk away from watching the market and you're already a number of pips ahead in the profit zone, consider moving your stop-loss to a break-even point or just beyond for a small profit at stop-out. The main thing is: don't leave your trade open without a stop-loss or with too wide of one. For longer-term trades, check back in when you can to adjust your stop to a more profitable level.
That's all for now. All the best in your trading endeavors.
Congratulations @m111! You received a personal award!
Click here to view your Board
Congratulations @m111! You received a personal award!
You can view your badges on your Steem Board and compare to others on the Steem Ranking
Vote for @Steemitboard as a witness to get one more award and increased upvotes!