Technical Analysis of STEEM/USD - Experiment day 4
Intro:
Using the Ichimoku Cloud as my trading tool and making a testable prediction about the direction of the price. Unlike the rest of these Chartists I make predictions, test them, and keep you updated on how they went.
Quick definitions:
The Blue line in is Tenkan-Sen (Conversion Line). It’s the midpoint of the last 20 price bars.
The light red (non-thick) line is Kijun-sen (Base Line). It’s the midpoint of the last 60 price bars
The Green (Thick) line is Senkou Span A (Leading Span A).
The red (Thick) line is Senkou Span B (Leading Span B). Both leading spans are plotted into the future.
The green line is the Chickou Span (Lagging Span), and will always lag behind the price; it’s the most recent price, plotted 30 periods back.
8/27/2018 1:17 am MST
Imgur:
Unfortunately my uploads failed a few times so I gave up :/
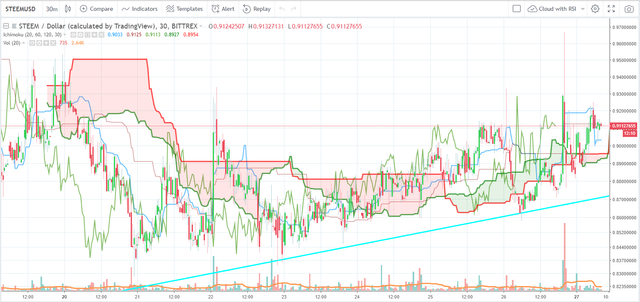
30 min
2 hour
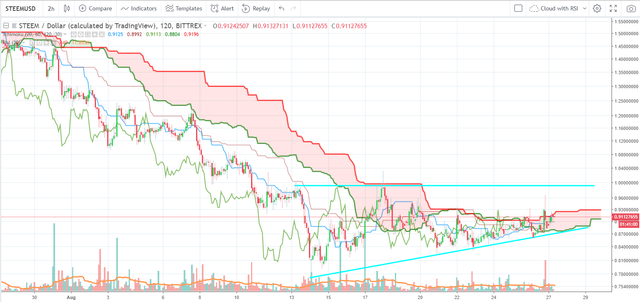
STEEM had a fairly large increase in volume today. That is a good sign. We can see a huge spike in volume around 20 UTC and a large bar up to 96 cents. That could be considered a breakout on the 30 minute chart. As we had seen some previous hits but no large breakouts supported by much volume. However, if we move to the higher time frame, 2 two hour, we see that it broke out of Leading Span B but came back into the cloud. The more times price tests those levels means the more likely they are to break. And seeing it supported by volume is very positive. Currently, on the 30 min time frame we are seeing price remain above both Spans and hopefully it will be supported by those Spans. However, it looks like the 30 min frame is more volatile and often breaks the support and resistances levels the Ichimoku cloud outlines. But the 2 hour time frame looks like it generally respects those levels. If i were trading here I'd look for a price breakout on the 2 hour time frame and buy in. As my cloud settings are set for double time crypto - We are seeing the 1 hour cloud in the 30 min time frame, the 4 hour cloud in the two hour time frame. This reduces false signals. Although, it's still not perfect.
Prediction:
It looks like a smallish ascending triangle is forming on the 2 hour time frame. The 30 min time frame looks similar but it's sloppy. However, I do like that volume was building so I'm more bullish than I was.
Prediction: possible breakout for the next 24 hours ideally a breakout above leading span B on the 2 hour time frame. Trading somewhere between 92 cents and 86 cents, hopefully breaking out above 92 and remaining there
Current prediction results:
Yesterday I said that it would sit between 90 and 87 cents. When I looked today it was at 91 cents. I call yesterday's prediction a failure.
Experiment day one - includes my rules
Current prediction rate: 33.33%
Conclusion:
Feel free to leave feed back, comments, and suggestions on anything - from the rules, to the quality of my TA, to how I could improve, ect.
If you are wondering why I'm doing this or why I'm creating rules or testing my predictions. Follow this link.
If you liked this content feel free to reblog, follow, and comment.
Who is klabboy?
I’m different than some steemians. I have never been be paid to create content (baring likes from fellow steemians), I have never paid for upvotes, and all my content is 100% created by me. Nothing fake, no agenda, just my thoughts, and your comments.
Further, I’m a crypto-enthusiast, economics student, data nerd, and outdoors lover. I post mostly on economics, data, personal fun/stories, and crypto. If you have an interest in those things and the occasional random topic, feel free to like, follow, and reblog my content. Hope to hear from you in the comments! Have a wonderful day!