Technical Analysis of STEEM/USD - Experiment day 7 - The STEEM recession
Intro:
Using the Ichimoku Cloud as my trading tool and making a testable prediction about the direction of the price. Unlike the rest of these Chartists I make predictions, test them, and keep you updated on how they went.
Quick definitions:
The Blue line in is Tenkan-Sen (Conversion Line). It’s the midpoint of the last 20 price bars.
The light red (non-thick) line is Kijun-sen (Base Line). It’s the midpoint of the last 60 price bars
The Green (Thick) line is Senkou Span A (Leading Span A).
The red (Thick) line is Senkou Span B (Leading Span B). Both leading spans are plotted into the future.
The green line is the Chickou Span (Lagging Span), and will always lag behind the price; it’s the most recent price, plotted 30 periods back.
9/5/2018 11:30 pm MST
Imgur: 2 hour and 30 min: https://imgur.com/a/TUBtOYj
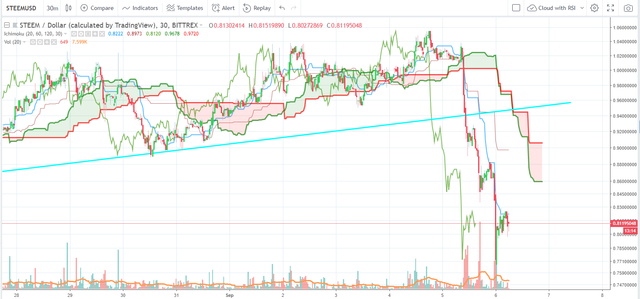
30 min:
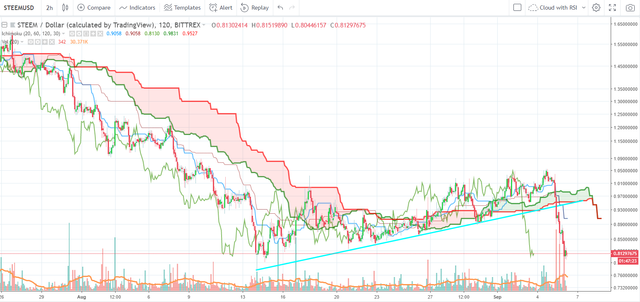
2 hour
Well... here is a perfect example of two things: The failure of TA and huge moves characteristic of cryptocurrency. Within the past day - 16 hours. STEEM has dropped about 20%. Breaking all previous support levels, the trend line that had held for so long, and broke even the best predictions out there. It looks like on the 30 minute level that it hit Senkou Span A raised a little and then a whale or multiple whales engaged in some massive sales. The volume was 3-12 times the previous amounts leaving anyone little time to react to the sell offs.
Interestingly enough this sell off brought us back down to where we were last month, which echos basically the year low. This could develop into a good double bottom reversal pattern here. However, we'd like to see some good green bars recovering one or two of the 2 hour red bars - up to around the 84 cent level. Although, I kind of doubt that will happen. If there is a strong green bar up to around this level that is a strong sign of a reversal and a long position should be taken.
Finally, this is a good example of why stop losses are so important. However, this is also a good example of how slippage and how active traders could take massive unexpected losses from simple slippage of trying to sell at a dollar, but because of the huge volume and sell orders, your order goes through at .95 cents or .96 cents making you take huge losses. Try to keep stop losses close to support or resistance levels but also bear in mind your potential risk might be 5 or 10 times greater than you originally expect.
Prediction:
Prediction: It looks like a possible flag is forming. As we see on the 30 minute chart there was a flag before the last precipitous drop. Frankly, I think we'll see another flag form and a retest of the low.
Current prediction results:
Last time... well it doesn't matter. Any prediction I made was wrong. It failed. :D
Experiment day one - includes my rules
Current prediction rate: 50%
Conclusion:
Feel free to leave feed back, comments, and suggestions on anything - from the rules, to the quality of my TA, to how I could improve, ect.
If you are wondering why I'm doing this or why I'm creating rules or testing my predictions. Follow this link.
If you liked this content feel free to reblog, follow, and comment.
Who is klabboy?
I’m different than some steemians. I have never been be paid to create content (baring likes from fellow steemians), I have never paid for upvotes, and all my content is 100% created by me. Nothing fake, no agenda, just my thoughts, and your comments.
Further, I’m a crypto-enthusiast, economics student, data nerd, and outdoors lover. I post mostly on economics, data, personal fun/stories, and crypto. If you have an interest in those things and the occasional random topic, feel free to like, follow, and reblog my content. Hope to hear from you in the comments! Have a wonderful day!