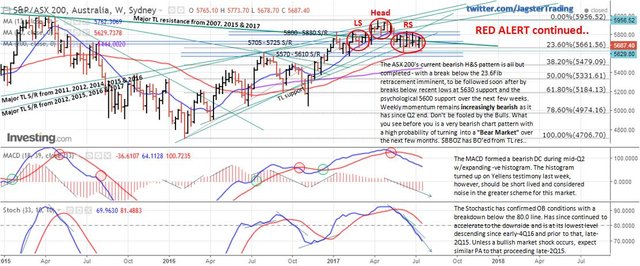
The ASX current bearish H&S pattern is all but completed, with further breakdowns imminent..

The ASX 200's current bearish H&S pattern is all but completed - with a break below the 23.6Fib retracement imminent near 5660, to be followed soon after by breaks below recent lows at 5630 support and the psychological 5600 support over the next few weeks. Weekly momentum remains increasingly bearish as it has since Q2 end. Don't be fooled by the Bulls. What you see before you is a very bearish chart pattern with a high probability of turning into a "Bear Market" over the next few months. $BBOZ has BO'ed from TL resistance..
The MACD formed a bearish down-cross during mid-Q2 with an expanding negative histogram. The histogram turned up on Yellens testimony last week, however, should be short lived and considered "noise" in the greater scheme for this market. The Stochastic has confirmed overbought conditions with a breakdown below the 80.0 line, and has since continued to accelerate to the downside at its lowest level descending since early-4Q16, and prior to that, late-2Q15. Unless a bullish market shock occurs, expect similar PA to that proceeding late-2Q15.
