Monday Markets Update: The S&P, the DJIA, the Nasdaq, and the 10-year
In lieu of tariffs placed on Chinese steel coming into the United States, the markets experienced a panic-like sell off. I personally, don't believe that the market volatility has anything to do with political news, but Yahoo Finance and MSNBC would have you think otherwise.
While ground breaking news can make a major impact, sometimes it is best to mostly tune it out and look at things with an objective lense.
On a technical standpoint, these markets were merely testing major support at previous lows created in the February selloff.
S&P 500
Today the S&P 500 dropped below its line of support at 2,585 and retested it's previous february lows. If this line of support holds tomorrow, it will make a move upwards towards its line of resistance and then later head back down to that same line of support.
Keep in mind, if it significantly breaks down below its line of support, this line will act as resistance.
Dow Jones Industrial Average
The Dow Jones is looking weak. It will likely experience similar price movement to the S&P but to a lesser extent.
Watch the Dow in the coming weeks and months. Its trajectory is likely to lead the way for the other indeces.
Nasdaq 100
Tech stocks in the Nasdaq are looking much stronger than the rest of the market.
I am expecting the Nasdaq to take a strong bounce upwards this week, then continue its move down along with the Dow Jones.
How do bond yields play into this?
Bond yield (or the price of debt) have a huge weight on how an economy is expected to perform in the future. When yields are low, money is cheap, businesses expand, and stocks rise in speculation of all of this. When bond yields rise, the economy begins to contract and stocks usually fall.
The 10-year US Treasury Bond tends to be the asset that traders and investors keep their eyes on, as it is said to be a leading indicator for the direction of the markets.
US 10-Year
The general direction of the 10-year is up. This is bad news for stocks. As the 10-year rises overtime, stocks will continue to become more and more volatile.
However, the 10-year has established a flag pattern. While an upward movement is near certain, the 10-year will most likely consolidate until mid-summer, then follow the trend up.
I hope this article has been helpful insight for the weeks to come. Drop a comment down below if you have any questions!
Another helpful technical indicator for reading the markets is moving averages. If you would like to learn more about them, read my article here.
Disclaimer: I am not a financial advisor. The articles that I write are for educational purposes only. Do your own research and hold yourself accountable for the investments that you choose to make.
Thanks for Reading!
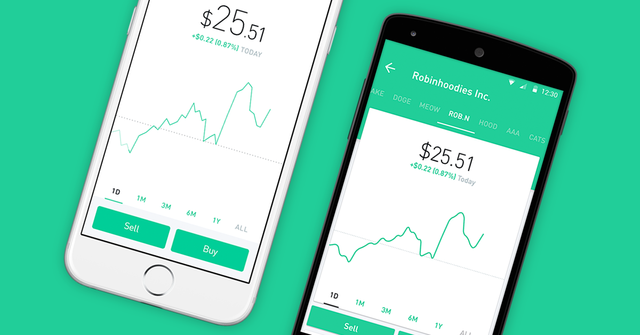
If you're interested in receiving a free share of stock, sign up for an account on Robinhood using my referral link:
http://share.robinhood.com/micahm18
Robinhood is the first zero fee stock market broker that offers free option trading, crypto trading, and much more. I make all my trades on this platform and pay no commission. This is a zero obligation sign up. All you need is your personal information such as your ssn, birthdate, and your name. Robinhood is an SEC and FINRA regulated company. Robinhood is fully monitored and registered with the SEC (securities exchange commission).

1 in 150 chance of getting a Facebook, Microsoft, or Apple Stock
1 in 90 chance of getting Ford, snapchat, or AMD stock
100% chance of getting a free stock
Robinhood... Taking from the rich, giving to the poor...
Follow me on social media:
Check out some of my most recent articles:
The Most Effective Way to Invest in the Stock Market
Why Saving Cash Will Make You Poor
Intelligent Investing: Becoming a Shrewd Investor
Cryptocurrency Market Update
How Do Gold and Silver Fair During Asset Deflation and Economic Recessions?
Wyckoff Logic: Finding Entry into a Market
My Portflio Strategy
Bitcoin: Testing Major Resistance
Yamana Gold (AUY): An Undervalued Stock with a lot of Potential
The Case for Precious Metals and Mining Stocks