Why I'm selling EURUSD right now!
THERE'S A SHARK... Pattern
Daily Chart EURUSD
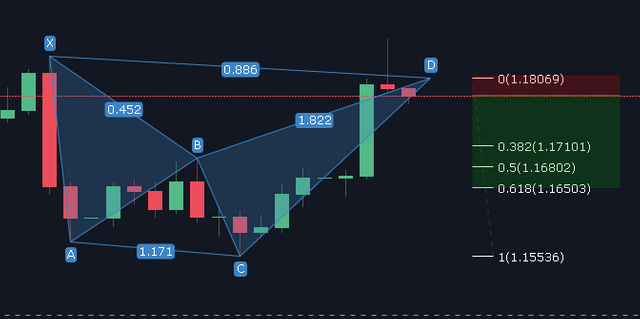
We've got valid measurements for a shark pattern,
A - x
B - x
C - 1.13 -1.618
D - 1.618 -2.24
X to D - .886 -1.13 (usually one or the other)
Once we find the pattern we look for the reversal which is illustrated well in the daily chart above, with the second red candle from D point. This Doji, or spinning top, sits at the bottom and shows a bearish reversal coming.
The longer timeframe, the more accurate the candlestick patten is.
Hourly Chart EURUSD
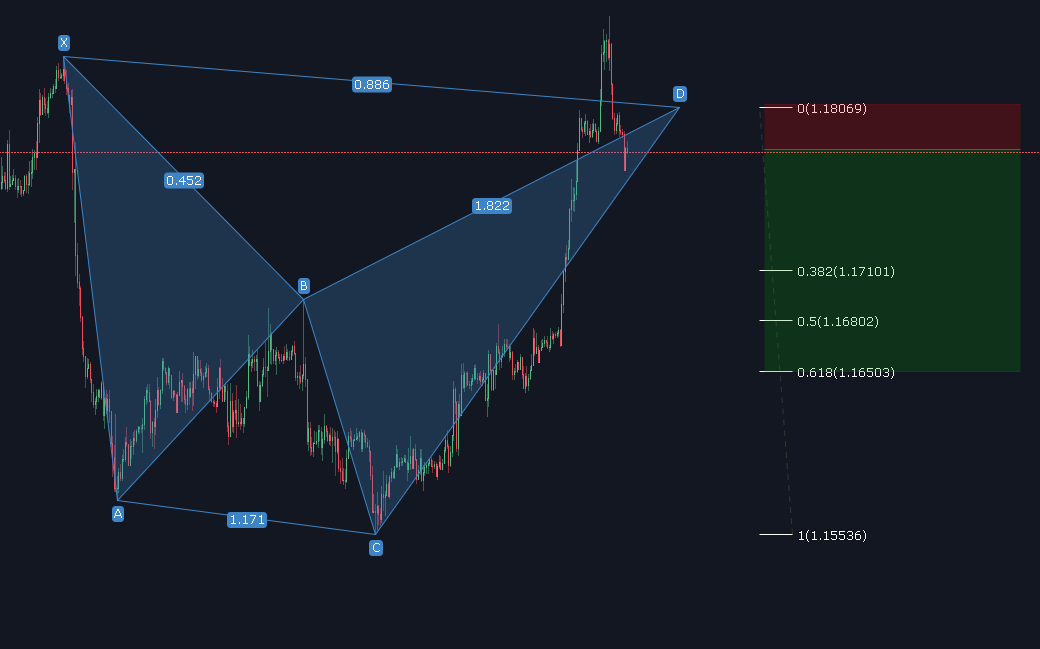
A little late but here we go!
Sharks usually hit at .886, but if I would have been a bit better with D point, we could have played the 5-0 as well
@originalworks
The @OriginalWorks bot has determined this post by @corganmusic to be original material and upvoted(1.5%) it!
To call @OriginalWorks, simply reply to any post with @originalworks or !originalworks in your message!