RE: Why Invest in Gold And Silver?
Well laid out argument. Here is a little more data to help with understanding the amount to hold. The chart is a Buy:Sell chart between the S&P500 (essentially the US stock market) and Gold. It shows what would have happened over 5 years if you had bought the stock market and sold gold.
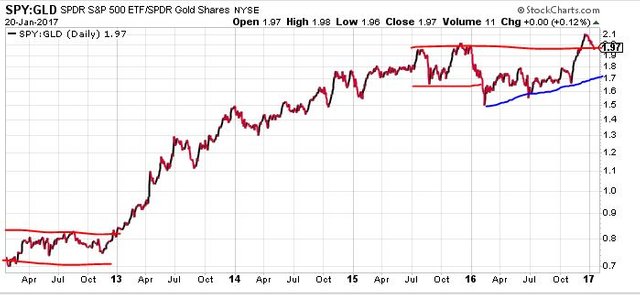
The way to understand the chart - if the chart is rising the bought side is outperforming the sold side. It shows that in 2012 one would have been indifferent and from 2013 to mid-2015 it was better to be holding the stock market and since then indifferent again. Over those 5 years one did not want to be over-exposed to gold - so no more than 10% (as suggested) as insurance would have felt right.
Now let's look at a different 5 year period (2005 to 2010) to span the GFC.
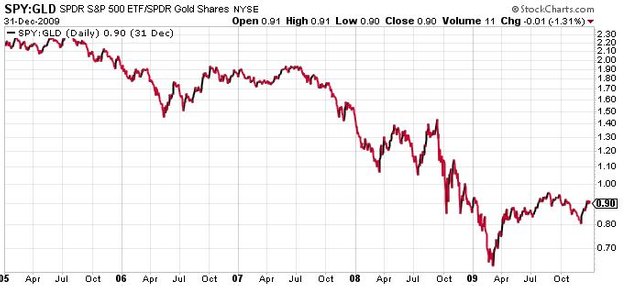
This tells a very different story where you would have been a whole lot happier holding more insurance.
Now the big question is can you work this out in advance? Like everything in markets it takes a little while for new patterns to emerge. But if you do the Buy:Sell chart at this level (a whole market vs Gold) you will see when the chart turns over. At that point you would be safer choosing to increase or decrease the amount of insurance you hold. So looking at 2009, one would have safely reduced Gold holdings in May/June 2009 (market actually turned in March 2009). Looking at now, one may have increased Gold in February 2016 (and would have been wrong - as the strong stock market correction was based on words from the Federal Reserve and not on fundamentals)
Incidentally the charts for other precious metals look less noisy than Gold but they show the same thing [using SLV for Silver and PPLT for Platinum].
The next question is how does one hold Gold? Buying and storing Gold has challenges (people like to steal it if they know you have it). For US holdings, I buy shares in the exchange traded funds GLD or in the gold miners GDX and GDXJ (these are listed in the US). These funds all have solid options markets too - so one can buy options to cover an anticipated price direction (Calls to go up and Puts to go down). There are also ETF's listed in other markets (I have holdings in UK and in Switzerland). One can also buy ETF's that are hedged to a particular currency (I have gold ETF hedged in Swiss Francs - so my gold holding becomes neutral to currency moves in Swiss Francs terms)
How to build a buy:sell chart? I use http://stockcharts.com. Type the Buy:Sell tickers in the box separated by a colon like this: SPY:GLD - then adjust the detailed settings to the timeframe you want (only 5 years at a time for the free version)