0x (ZRCBTC) Buy target and redicted profit target
0x (ZRXBTC) is predicted to move much higher - a ton higher in factor. It's rare for any instrument to be trading directly where it 0x is currently trading - but it is. And this presents a crazy awesome trading opportunity.
0x (ZRXBTC) sitting, literally, at a crossroads.
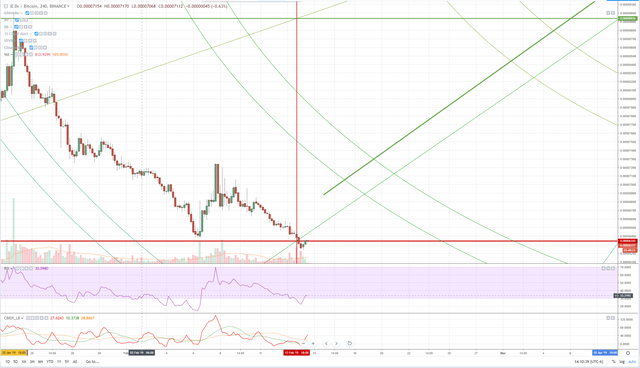
One WD Gann’s ways of predicting future price action and forecasting of future profit targets was identifying areas where price and time are squared. I’ve learned that Gann’s used of the word ‘squared’ doesn’t always mean a confluence zone of one of his Square’s to one of his time cycles – but in the case of 0x, that is the case. 0x is sitting, right on a square of price and time. Notice the intersection of the red vertical and horizontal lines on the chart. Both of those lines represent an important behavior: pivots. The natural time pivot (red vertical line) is important because it acts as a source of resistance in time to the trend in force. Time cycles themselves are often powerful enough to predict future price action, but 0x has another thing that helps with that prediction. The 0.00006343 value area is 2/8th Major Harmonic level. Major Harmonic levels are the most difficult price levels for traders to trade above or below. And each harmonic level has a different ‘behavior’ in the case of this current 2/8th Major Harmonic – it represents a natural pivot, the most powerful pivot on a chart. When price action is trading right inside this confluence zone – especially after such a prolonged downtrend, we can predict and expect powerful bullish moves in the very near future. As far as finding a price zone to predict, that becomes a little easier. Given the strength of this confluence zone, the next and most logical profit zone is the 4/8th Major Harmonic level at 0.0001530. We can even predict the date range. The next square of price and time happens on April 2nd, 2019 at the 0.0001530 price level. Price action tends to trend in one direction between these two time harmonics.
Bitcoin flagging pattern continues
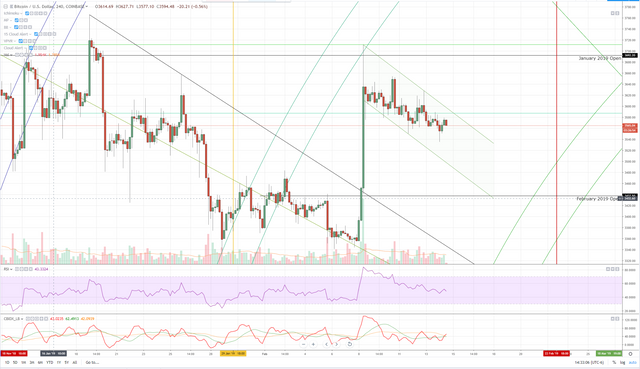
Bitcoin has been trading in a consistent pattern since its most recent drive higher on February 8th, 2019. There is a very predictable and common bullish continuation pattern that has formed: bullish flag. Over the last 4 hours, Bitcoin has traded higher and it looks like traders are interested in testing the upper band of the bullish flag. An ideal scenario would be a breakout of the flag pattern, and then a close above the most recent swing high at the 3692.20 value area. This would provide a strong breakout pattern to thrust Bitcoin higher. But Bitcoin continues to display weakness. We are halfway done with February and if we were to close at the present value area, this would be the first month in 6 consecutive months where the monthly close was higher than the monthly open. It would be marvelous if we could see February at least match or exceed the prior month high of 4114.80. It has been 7 months since any monthly candlestick has met or exceeded the prior month’s high. Once we get a monthly candle that closes higher and exceeds the prior trading months high, we can consider a new bull trend to be in the works.
Congratulations @captainquenta! You have completed the following achievement on the Steem blockchain and have been rewarded with new badge(s) :
Click here to view your Board
If you no longer want to receive notifications, reply to this comment with the word
STOPTo support your work, I also upvoted your post!
Do not miss the last post from @steemitboard: