Chart of the day: The big divergence between GDP Growth and US Equities Indexes
Currently the US economic expansion remains the slowest in recent history.
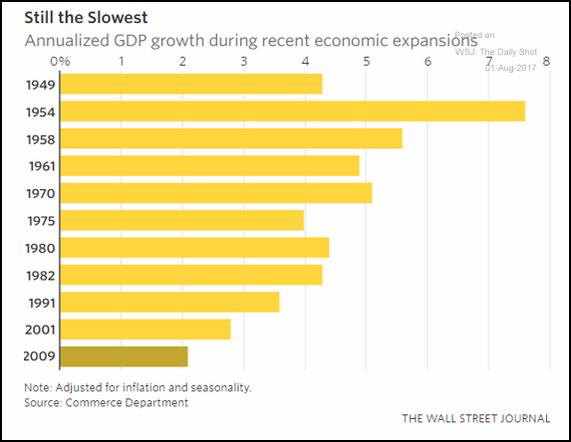
Source: Wall Street Journal
At the same time the Dow Jones Index is, in terms of Price to Sales Ratio, more expensive than in the Dot-com bubble

Source: Bloomberg
Can somebody help me to understand this divergence?
Best
Congratulations @ayusor! You have completed some achievement on Steemit and have been rewarded with new badge(s) :
Click on any badge to view your own Board of Honor on SteemitBoard.
For more information about SteemitBoard, click here
If you no longer want to receive notifications, reply to this comment with the word
STOPTal día como hoy, santoral de las María de los Angeles, la divergecia hace que el Dow Jones supere los 22.000 por primera vez en la historia reciente.
Se acuerdan de aquello de : "Diga 33" Pues eso, a divergir.
PD: Bendito sea el cochino jabalín, que sale entre las jaras asustando al pájaro perdiz.
Buena tarde @ steem i ans
aquí los únicos que nos pueden dar luz son @wese y @macumbo
jajaja pues que nos den luz ya, les necesitamos...