Did The Market Just Get Infected?
Just last week, we were asking the opposite question, as traders were believing that the market had immunity to the risks from the “coronavirus.”
This was a point we discussed in Monday’s technical market update.
“As noted last week: ‘With the market now trading 12% above its 200-dma, and well into 3-standard deviations of the mean, a correction is coming.’ But the belief is currently ‘more stimulus’ will offset the ‘virus.’
This is probably a wrong guess.
Extensions to this degree rarely last long without a correction. Maintain exposures, but tighten up stop-losses.
SPY Chart 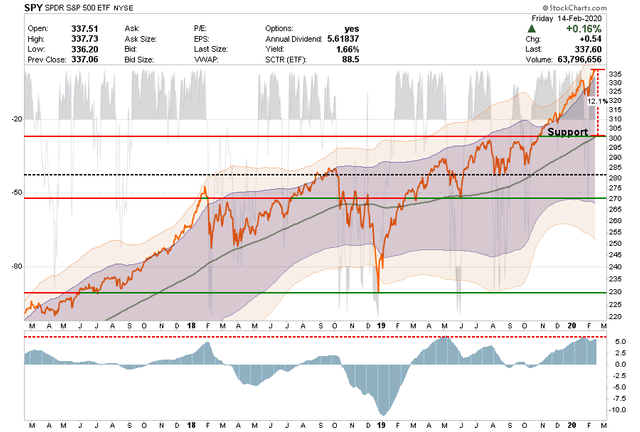 SPY Chart
That correction came hard, and fast on Thursday and Friday.
For the week, the market declined, but it was the “5-Horseman Of The Rally” (Apple (NASDAQ:AAPL), Microsoft (NASDAQ:MSFT), Google (NASDAQ:GOOGL), Facebook (NASDAQ:FB), Amazon (NASDAQ:AMZN) which led the way lower. This is the first time we have seen a real rotation out of the “momentum chase” into fixed income and was a point we discussed in Thursday’s RIAPRO Intermarket Analysis Report. To wit:
“Stocks and bonds play an interesting ‘risk on/risk off’ relationship over time. As shown above while stocks are extremely outperforming bonds currently, the relationship is now suppressed to levels where a reversion would be expected. This suggests that we will likely see a a correction in equity prices, and a rise in bond prices (yields lower), in the near future.”
Aggregated Bond ETF:SPDR S&P 500 ETF Chart 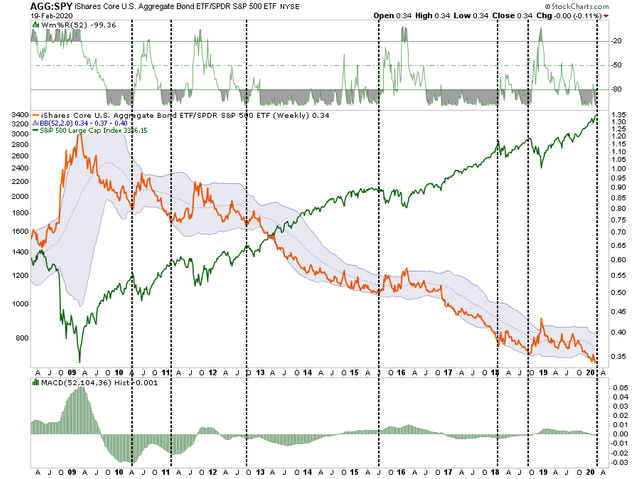 Aggregated Bond ETF:SPDR S&P 500 ETF Chart
Currently, this is just a correction within the ongoing bullish trend, however, there are things occurring that do not rule out the possibility of a larger correction in the short-term.
Carl Swenlin from Decision Point (h/t G. O’Brien) came to a similar conclusion.
“Yesterday (Thursday) SPY (NYSE:SPY) penetrated the bottom of a short-term rising wedge, but couldn’t make it stick. Today was a different story, but the support line drawn across the January top impeded excessive downward progress. The VIX didn’t quite reach the bottom Bollinger Band, but it is possible that we will see continued weak price action similar to the short January decline if the VIX breaks through the band. Being so close to the band, the VIX is also oversold, so it is also possible that we’ll see a bounce.”
SPY Daily Chart 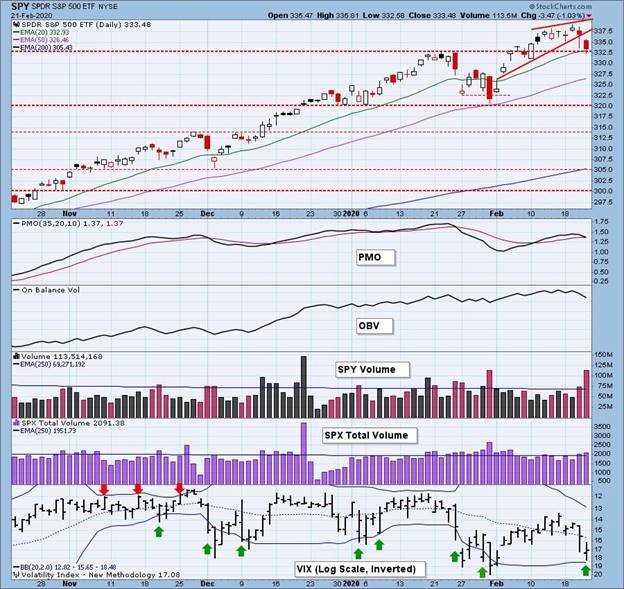 SPY Daily Chart> “The intermediate-term market trend is UP and the condition is SOMEWHAT OVERBOUGHT. The negative divergences spell trouble, and all four indicators are below their signal line and falling.
The market has been so resilient that it is hard to think that anything more than a minor pullback is possible. A critical breakdown below the January top hasn’t happened yet, but that could be the first move on Monday. Indicators in the short- and intermediate-term are falling, and negative divergences are abundant, so I think that next week will be negative. That may just be the beginning.”
SPY Chart 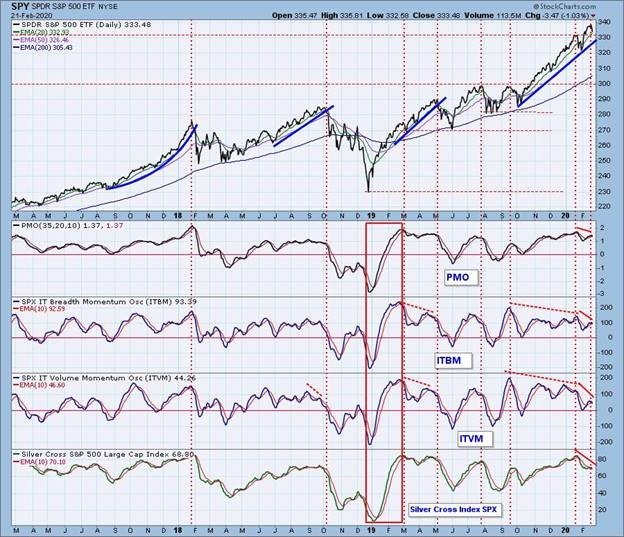 SPY Chart
We agree with that assessment. Remember, it never just starts raining; clouds gather, skies darken, wind speeds pick up, and barometric pressures decline. When you have a consensus of the evidence, you typically carry an umbrella.
Evidence is clearly mounting, and one of the bigger concerns to the market, and particularly to the commodity space, is the surge in the U.S. dollar. This past Monday, we wrote:
“As noted previously, the dollar has rallied back to that all important previous resistance line. IF the dollar can break back above that level, and hold, then commodities, and oil, will likely struggle.”
That is exactly what happened over the last two weeks and the dollar has strengthened that rally as concerns over the ‘coronavirus’ persist. With the dollar testing previous highs, a break above that resistance could result in a sharp move higher for the dollar.
The rising dollar is not bullish for Oil, commodities or international exposures. The ‘sell’ signal has began to reverse. Pay attention.”
USD Chart 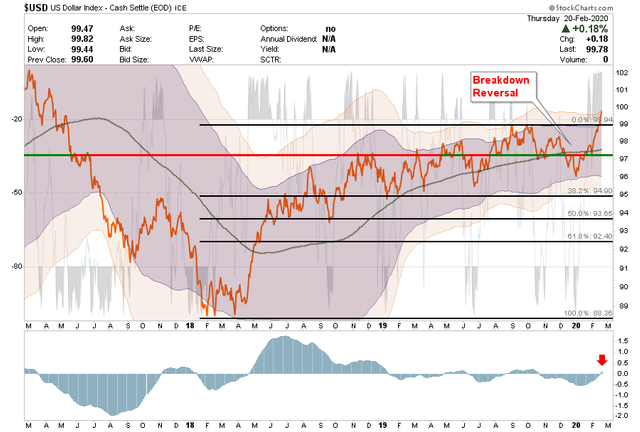 USD Chart
This surge in the dollar is also responsible for the sharp drop in bond yields as money is flooding into USD denominated assets due to the coming global impact from the coronavirus.
This is a substantial risk to the markets over the rest of this year which has not been factored into asset prices as of yet.
Furthermore, the main driver behind stock prices since last October has been the flood of liquidity from the Federal Reserve. However, that push of liquidity has quietly gone subsided over the last few weeks.
Fed Balance Sheet 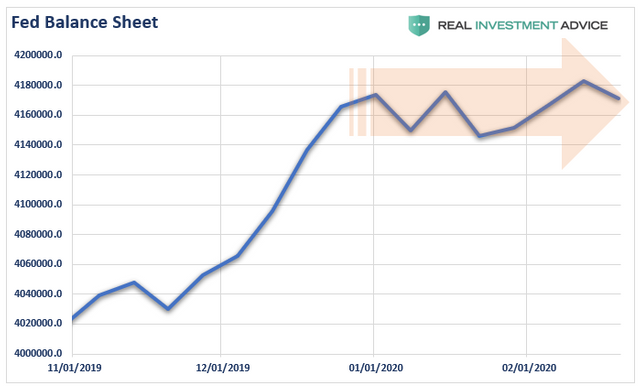 Fed Balance Sheet
This was well telegraphed by the Fed previously but was reasserted this past week as the Fed noted it was in no rush to cut rates and would continue reducing “repo operations,” both into, and following, April.
Given the “bull thesis” has been “liquidity trumps all other risks,” with the Fed funds rate at 1.5% currently, and liquidity flows being reduced, “risks” now have a stronger hand. When you combine reduced liquidity with a surging U.S. Dollar, and collapsing yields, investors should reassess their positioning accordingly.
As my friend Victor Adair from Polar Futures Group stated on Friday:
“The EUR/USD jumped sharply (after falling steadily YTD) and the spooz took another leg down. Could there have been a European institutional account positioned in US stocks which suddenly decided, like the Jeremy Irons character in the Margin Call movie, that they didn’t “hear the music” anymore, and decide to sell? If they had owned US stocks without hedging their FX risk the temptation to hit the SELL button given the recent huge rallies in both US stocks and the US Dollar would have been huge! I think the S&P 500 can continue lower.”
POSITIONING REVIEW & UPDATE
We have been concerned about the potential for a correction for the last three weeks. Given that we previously took profits near the market peak in January, there was not a tremendous amount of work we needed to do on the equity side of the ledger.
However, this past Monday we did extend the duration of our bond portfolio a bit, and changed some of the underlying mixes of bonds, to prepare for a correction. With the sharp yield spike over the last couple of days, those positioning changes worked well to reduce volatility.
We are using this correction to rebalance some of our equity risks as well. The bull market is still intact, so it is not time to be bearish in terms of positioning, just yet. However, we are maintaining our hedges for now until we get a better understanding of where the markets are headed next.
S&P 500 Daily Chart 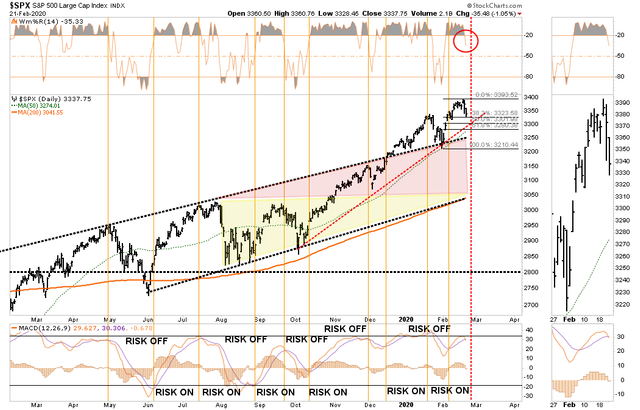 S&P 500 Daily Chart
Currently, there are several levels of support short-term. The market bounced off initial support at the 38.2% retracement level at the end of the day on Friday. However, we suspect we will likely see more follow-through next week, particularly if the dollar continues to strengthen. Downside risk currently resides at 3250, but a break below that level will suggest a much bigger correction is underway.
Longer-term, given the unrecognized impact of the virus on the economy, we expect a bigger decline down the road. As Doug Kass noted on Thursday:
“Caution is warranted. What we have all learned of the virus is that it is easily transmitted. It is asymptomatic, well established and it is spreading. As I have also noted its spreading has been under reported and, unlike other market headwinds, the liquidity provided by central bankers will have NO impact on the damage inflicted by the virus’ contagion.
Among other issues, global travel will be decimated and this will have unusual ‘knock on’ effects. Tourists, especially Chinese ones, spend lots of money. This will be a GLOBAL problem as China was to be a source of big growth for this sector. Retailers of EVERYTHING are going to miss budgets and economies like Japan and South Korea are going to be devastated by the impact.
In Japan, this will come after a massive (and ill timed) tax increase. Tech will play the role of major (not minor) collateral damage as long held supply chains are damaged/crushed.
Most investors, focused on price action, have little idea what could hit them.”
We are keenly aware of the risk, and while we are not “selling heavily and moving to cash” currently, it doesn’t mean we won’t.
We are paying attention to what the market is saying, and following directions accordingly.
Are you?