Emini S&P 500 Outside-Down Candlestick With Bear Body
PRE-OPEN MARKET ANALYSIS
After 2 huge days down, yesterday was a weaker bear trend day. There was a wedge bottom on the 5-minute chart. But, instead of reversing up, the Emini went sideways. That is a sign that the bears might not yet be ready to take some profits. It made lower prices likely today.
The selloff continued overnight and today will probably open with a big gap down. The Emini was near a 10% correction overnight. That is a magnet just below the Globex low.
February is an extremely big outside down month. There are only 2 trading days remaining. Traders will fight over how the candlestick will look on the monthly chart when it closes tomorrow. The bears would like the month to close on its low. That would increase the chance of lower prices in March.
The bulls, however, are hoping to see some short covering before tomorrow’s close. If they do, they, too, will buy, looking for at least a 1 – 3 day bounce.
Because the selloff has been extreme, the bounce could be extreme as well. The bulls would like to see strong short covering begin today or tomorrow because February would then close above its low on the monthly chart. That would reduce the bearishness going into March.
OVERNIGHT EMINI GLOBEX TRADING
The Emini sold off early in the Globex session and then entered a trading range. Since it is down 43 points, today will gap down when the day session opens.A big gap down means that the Emini will be far below the 20-bar EMA. Day traders do not like to sell far below the average price. Consequently, when there is a big gap down, there is only a 20% chance of a strong bear trend from the open.Instead, traders expect a trading range open for the first hour or two. By going sideways, the Emini will get closer to the average price. At that point, traders will look for either a double bottom or wedge bottom to buy for a swing up, or a wedge rally or double top near the EMA for a swing down.Normally, a trading range open reduces the chance of a huge trend day up or down. However, what has been going on this week is not normal. Day traders will be prepared for a surprisingly big trend day up or down. With the daily chart as oversold as it is, if there is a big trend, up is more likely. But it is important to be ready for anything.Finally, with the bars and swings as big as they are, day traders need to trade small position sizes. For example, if many of the bars on the 5 minute chart are 15 – 20 points tall, a day trader with less than a $50,000 account should either trade micro Eminis, trade some other market like the SPDR S&P 500 (NYSE:SPY) or Invesco QQQ Trust (NASDAQ:QQQ), or wait for the bars to get smaller.YESTERDAY’S SETUPS
Emini S&P 500 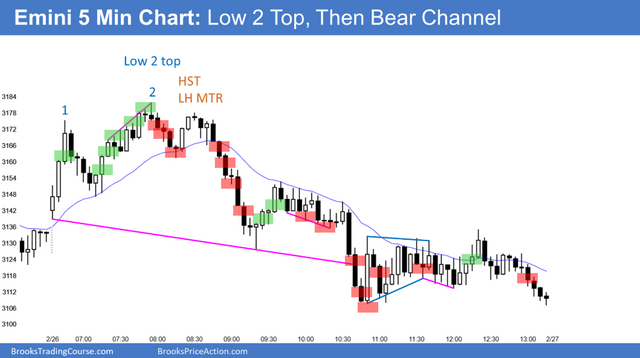 Emini S&P 500
Here are several reasonable stop entry setups from yesterday. I show each buy entry with a green rectangle and each sell entry with a red rectangle. I rarely also show limit order entries and entries on the close of bars. Buyers of the Brooks Trading Course and Encyclopedia of Chart Patterns have access to a much more detailed explanation of the swing trades for each day.
My goal with these charts is to present an Always In perspective. If a trader was trying to be Always In or nearly Always In a position all day, and he was not currently in the market, these entries would be logical times for him to enter.
If the risk is too big for your account, you should wait for trades with less risk or trade an alternative market like the Micro Emini.