Is ETHEREUM [ETH] Bull Run Comes In July With 13% Spike? Ethereum (ETH) Price Prediction
Hello everyone this post is all about Ethereum[ETH].We all know Ethereum is the 2nd highest Marketcap at this time when article is writing it is $47,264,799,855 when you read this Article it is may be chanced.In last 7 days All cryptocurrency was boom and get a huge spike with 10-50% up.
In this segment Ethereum also increased by 13.3% this time ETH price was $470.10 And it is loss 2.2% in the last 24 hours.
As we know the founder of ETH was Vitalik Buterin.He make ETH to become a decentralied.the main focus of this coin is to allow decentralised applications to run on top.This decentralised system is also known as ERC-20 Plateform.This blockchain allow to use it’s blockchain for other crypto tokens like NCASH,HOT etc.
At this time ETH faced a huge problem regarding transaction speeds.ETH currently handle only 25 transaction per second.This is very very tiny if you compared to any other crypto coin who has 1000s of transactions per second even some of crypto coins has million of transaction per second. Also this time ETHEREUM transaction fee is much more so I really suggest you please do not transfer your ETH to other wallets because this time the Gas price for ETH transaction was incresd.
Okay let’s move on Chart Analyse for long term.
ETH/USD – LONG TERM – DAILY CHART
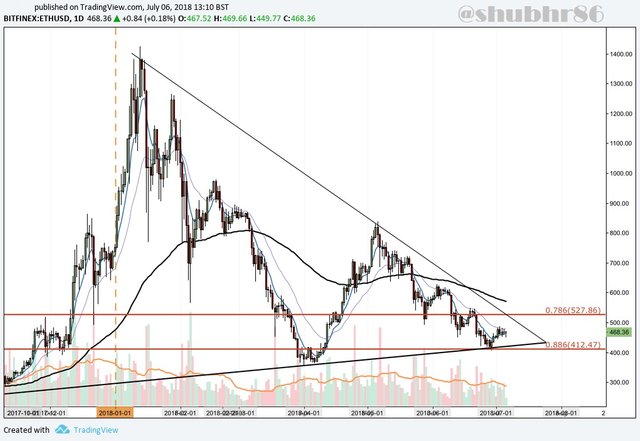
ETH day one chart-
We see in this chart the ETH market bullish in 2017.When the ETH price was hit at $1424 this is the all time high for ETH and this is done on 13th of January 2018.This the time when All Crypto market on boom.
Here we see a clear sign for how much growth in Crypto market.On 2nd of November 2017 ETH price was only 275 usd and after 2 months when market behaviour truns into bullish movment we see a 400% profit from 275$ to 1424$.Basiclly we say “THIS IS THE POWER OF CRYPTO’’.
After All time High market goes in bearish trend and this is not only with ETH this is done for all Crypto After falling and Falling ETH price goes to 358$ in April.This is place the ETH maket found support.
886 Fibonacci Retracement priced at $412. The Fibonacci Retracement was taken from the entire bullish run outlined above.
Here we also see symmetrical triangle price was bounced off the lower support for the triangle.
If price action can break above the .786 Fibonacci Retracement, then this would leave the market open to continue to trade higher.
In this market All types of trader involve.so let’s check SHORT TERM Analysis.
ETH/USD – SHORT TERM – DAILY CHART
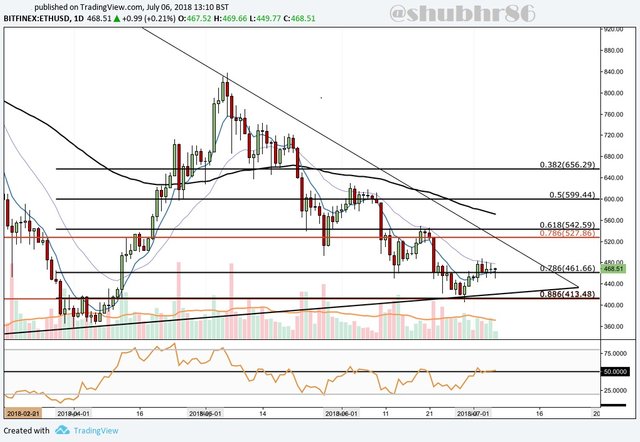
ETH Daily
In this short term Chart we see that the market was bullish second time this is not a higher growth in ETH market but ya this growth is Approx 130% form 358$ to 838$.
In this short term when maket found support on 358$ on April 2nd then makert recover slowly and goes 838$ on 6th may 2018.
After 130% high from 358$ to 838$ price fallen down basically this is the rule of Crypto whenever price goes to high then a day come when price comes down.so if you want to survive in crypto world so please rember this think.
Okay let’s comeback on our Analyis After falling time ETH finding support at 0.618 Fibonacci Retracement & At the end of may ETH price was 542$.This is a short term Fibonacci Retracement taken fro the bull run seen during April and is drawn in black.
In the month of June ETH price still fallen and break down 0.786 Fibonacci Retracement.At the end of fallen and fallen ETH find support at 0.886 Fibonacci Retracement at a price of $413.
IT is important to note that in this area there is a confluence of a short term and long term .886 Fibonacci Retracement, adding to the support found in this area.
Once again ETH found support at 0.786 Fibonacci Retracement at the price 461$.If market goes along with bullish movement and no FUDs and Negative news comes in the market Then we aspect the ETH price will be go higher but before we think ETH goes into bullish the market must cross or hold 542$ which is the 0.618 Fibonacci Retracement.Resistance further higher than this level is located at June’s high close to $600 followed by the 0.382 Fibonacci Retracement priced at $656.
Here,we know that all thinks have dual aspect even a coin have two espects like heads and tails similarly in crypto market if you want profit then loss is also a 2nd aspect that you remember.here i’m not try to dare you or given any advise for quit in market. These are the probability i share you if the bearish trend re enters in the market we see a huge dump also.
Opposilty we already talk about on this matter if bullish segment and trend continous in the market we see a huge pump same as last year.
I think you know what i’m trying to say. So let’s back on our topic if the bearish trend comes into the market the nearest level of support at the bottom of the symmetrical triangle.Support following this level is located at the .886 Fibonacci Retracement followed by April’s low at $358.
Also a short look on RSI it has been in a major role in the market if break above the 50 handle. In the last 3 times RSI failed to break above 50.If RSI able to break above 50 that the most important bullish moment of the ETH.
Conclusion-
Here i provide you all ways if Market goes into bearish trend then we see a huge dump or if maket recover slowly then bullish trend mark ETH price to All time high for this year.
We know that last year ETH price goes approx 400% this why i fouced on Long term Investment so i belive in long term holding.what is your holding Is SHORT or LONGTERM? Please mention in comments.
What is your opinion about ETH price prediction? Are you hold your ETH for long-term


You have a minor misspelling in the following sentence:
It should be remember instead of rember.