Bitcoin (BTC) Technical Analysis Weekly Chart

ANALYSIS BY SRnetworker,
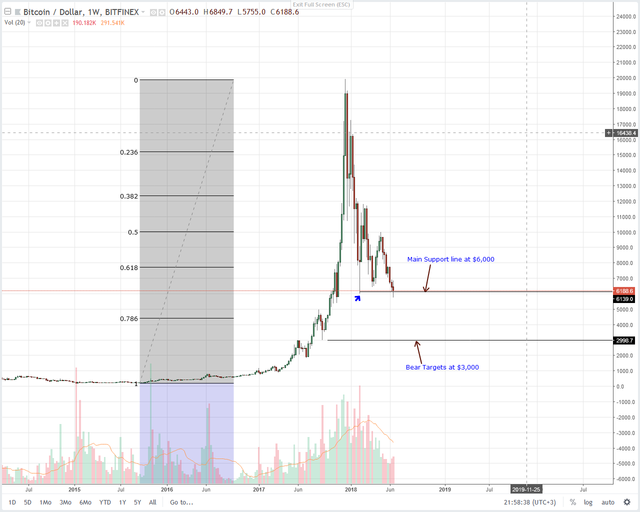
At 75 percent down from Bitcoin ATHs at $20,000, BTC prices are down $14,000 and trending for the first time this year below $6,000. All things constant, it will be wise to trade with the trend. So, after last week’s bearish break down candlestick, looking for pull backs specifically in the 4HR chart if you prefer trading from the weekly chart would be ideal.
In my view, the combination of fundamental events and talks or regulation would be the main undoing for BTC valuation. As such, until we have clarity, Bitcoin will continue to haul other coins with them. In the weekly chart, the first region of support in-case we see a follow through this week stands at $4,500 or the 78.6 percent Fibonacci retracement line. If there is a further break down, then aim for $3,000 as laid down before.
this would be very helpful to those people who are right now dealing with bitcoin or holding it for long term
yes btc hold in 2019 end very good profit in bitcoin
Good sharing keep it up... upvoted.
upvote me back thanks 👍
You have good knowledge...keep writng