You are viewing a single comment's thread from:
RE: 5th Sigma, 7th Sigma, 8th Sigma.......
I think visually..so those graphs are great.
Next subject...what makes the bell tall and skinny or short and squatty.....and tails..
(mustn't forget the tails)
So as you would have already seen during your research, this is nothing but an idea of how far something is from the mean value. The Gaussian/normal distribution (or more practically the bell) is on a x-y plane.
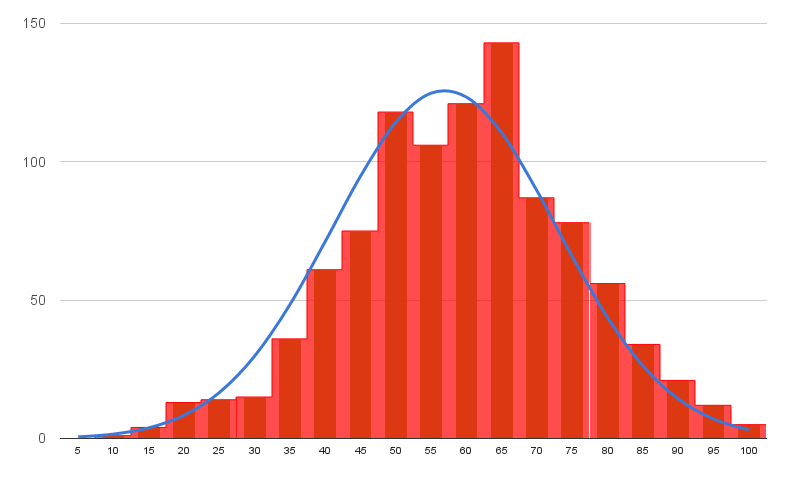
So if we draw the distribution for a school test marks of a class, then x-axis could be the marks and y-axis would be the number of students.
In the above picture as you can see that students getting a 100/100 are in the far right (very few) and the students getting 0/100 are in the far left (very few) of the bell. Also most of the students have average marks of 60-65 and are in the middle (very high number).
This pattern indicates that most students would get marks closest to the average marks of the class. Students scoring very high or very low marks are fewer and fewer.
In this case the height indicates the number of students and the width indicate the marks they get. Thus a higher concentration of students near the median would make the bell taller and vice versa.
As for the tails. The slope gradually tapers of and flattens along the axis. Thus the distance of a point on the curve to the x-axis closes down to zero the further we move. This indicates a lower and lower chance of something/someone being there. Now since are date set is finite, i.e. even if one students gets a hundred or a zero the tail would never touch the axis.
For an ideal infinite data set, the tail would also not touch but would keep approaching a point where it might touch it. Thus the phrase - 'approaching zero' or 'tending to zero'.
The Gaussian/normal distribution (or more practically the bell) is on a x-y plane.
two dimensional....
just two.
OMG!....we're NOT flatlanders...
Oh...the realization of what this means is staggering.
Ha-ha. Sorry for making it sound so childish.
oh no..far from it.