Graphing from Algebra to Calculus - Not for Rocket Scientists... For Anyone! (Pre-Calculus)

Pre-Calculus
This is where graphing get a little more intense, but once you have it you will be ready for the Calculus section (no problem). I always tell my students that Calculus is a lot easier than Pre-Calculus because it is! Let's begin!
Discontinuities

I will start with piecewise first because it will not be used in the rest of the lessons. A piecewise defined function is two or more equations with set domains (or x-values). For example, we may have y=2x+1 for x values less than 1 and y=-3x+2 for x-values greaterthan or equal to 1. Practice graphing this one yourself!
Asymptotes are actually easy to find, but graphing with them takes practice. It is not a part of the graph, it is actually where the graph is not! An asymptote is found when the denominator (bottom) of a function equals zero (you cannot divide by zero).
Examples:

Two ways to think about this. 1) Ask yourself what numbers, if you plug it into x, will make the bottoms zero, or 2) Set each of the bottom pieces to zero. Since it is more visually appealing we will use (2):

These are vertical lines that our graph will never touch. Like in the asymptote picture above we can see what ours would look like on a graph:
f(x)

g(x)

x = -3, x = 0, and x = 2
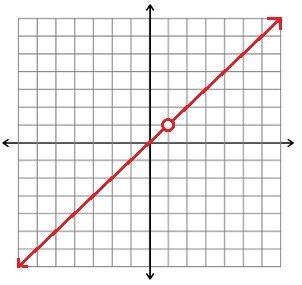
- Holes are asymptotes that are "removed", by dividing it out. For example, if you are said to graph:
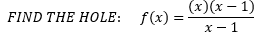
What happens is that anything that is the same on the top and bottom cancels out, but you are still not allowed to plug in the number that would make the bottom zero! Our hole here is at x=1. The new equation is what we are graphing, but with a hole at x=1. You can graph this with a table or y=mx+b.


Graphing With Characteristics
Graphing with characteristics requires all of what we have done so far up to this point. There are several things we need to look for to accomplish the goal. Things to find:
- Asymptotes (Vertical, Horizontal, and Oblique)
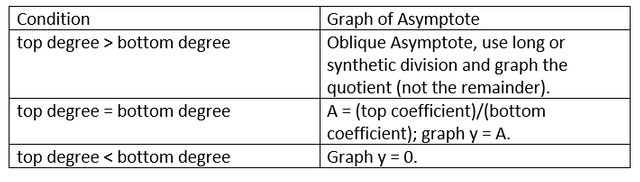
Above I talked about vertical asymptotes, now let's cover the next two. Horizontal asymptotes are based on the degree (highest power) of the top/bottom of a function. The main difference between a vertical and horizontal asymptote is that horizontal asymptotes can be crossed. Say we had this function:
Here is a table of horizontal asymptotes:
- Intercepts (x and y)


- x - int: To find where it hits the x-axis plug in y = 0 and set it equal to the top of the function.
- y - int: To find where it hits the y-axis plug in x=0 and simplify.
Examples:
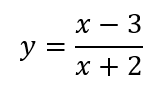
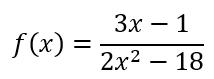
Graph:
Work: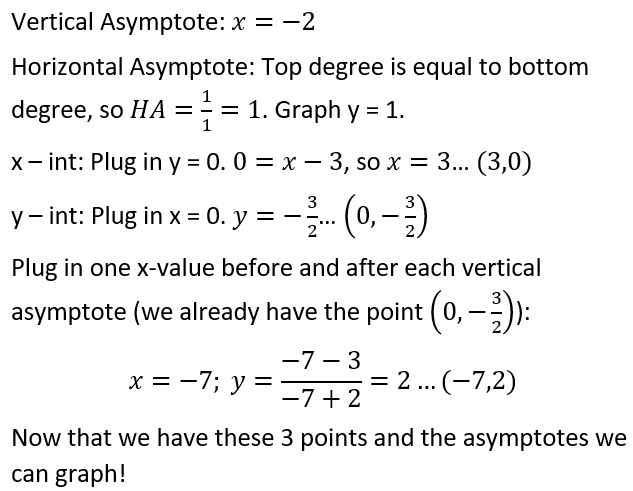
Solution: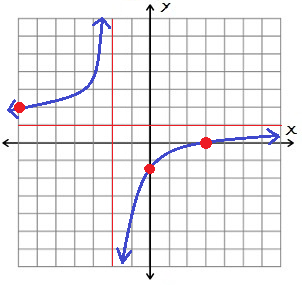
Graph:
Work: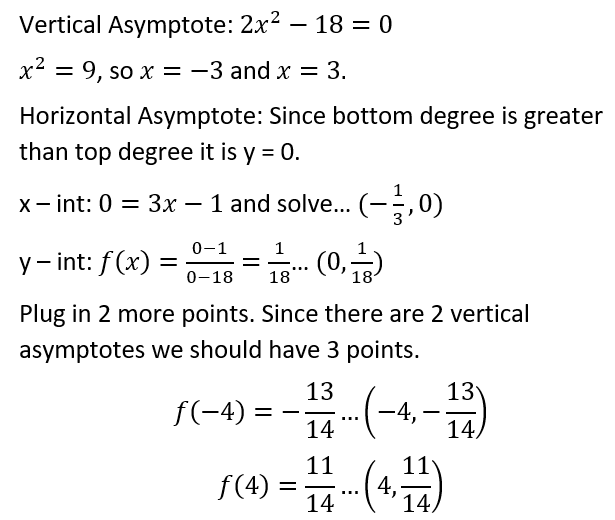
Solution: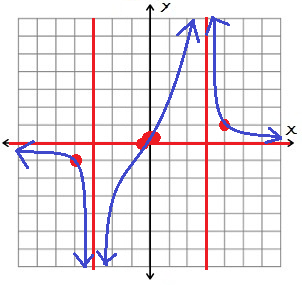


.gif)
Awesome post dear friend... but I cant about it.
Start from the algebra post! Haha. You don't need to know it. It's really worthless information unless you need a mathematics or engineering type degree.