Representing data - Lesson 2
Histograms
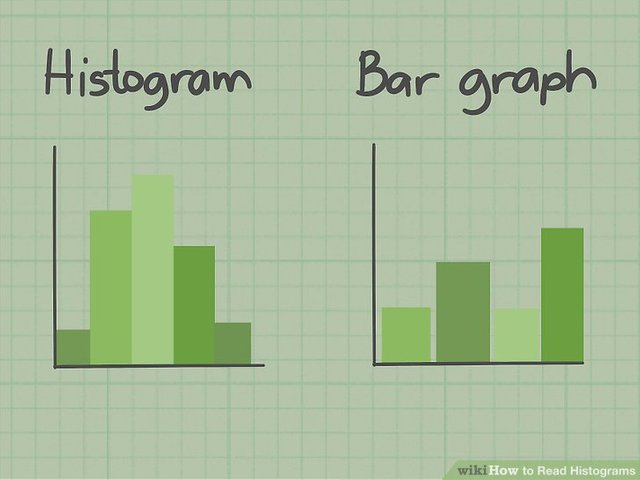
A new kind of graph that we introduce to grade 7 learners is the histogram. Just like a bar graph, a histogram consists of bars.. The main difference between a bar graph and a histogram is that a bar graph is used to display discrete data (data that has been counted) and a histogram is used to display data that has been grouped into intervals. The intervals must be consecutive and they may not overlap. The second difference between a bar graph and a histogram is that the bars of the bar graph does not touch, but the bars of a histogram always touch.
Example:
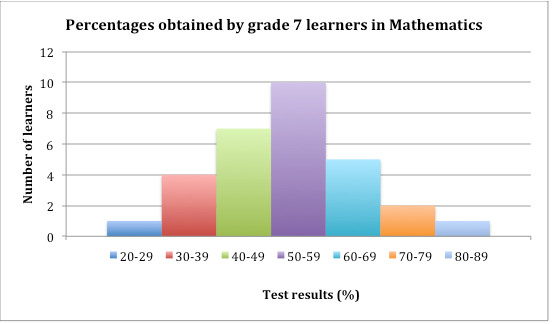
A grade 7 class with 30 learners wrote a Mathematics test. The teacher converted each of the learners mark into a percentage and then grouped the results into different intervals.
The information is shown below:

The table above has 7 intervals. This means I can place the percentages of the learners underneath each interval and add them all together when I am finished writing all the learners percentages.
I write each learner's percentage under the correct interval.
After the teacher wrote the intervals of the percentages, she represented the data in a histogram as shown below:
The histogram is used to display continuous data. Continuous data is data that is measured.
For example, if we measure the height of each learner in the class, and there are 30 learners in a class, it is not practical to draw a graph with each learners' height, instead, we group the heights together into intervals. Remember that growth is gradual, you can't be 1 meter tall the one day, and expect to be 1,5 meters the next day.
Most important is to remember that the intervals can not overlap each other, for example, we can't have intervals of 20-29 and 29-39, because the number 29 is in both intervals, so where are you going to place the number?
Key words to remember:
- Histogram: a graph that uses vertical bars to show grouped data
- Discrete data: data that is counted
- Continuous data: data that is measured. (Can be grouped in intervals)