Representing data - Lesson 1
For the next few lesson we are going to focus on how to represent data in different ways.
- Lesson 1 - Bar graphs and double bar graphs
- Lesson 2 - Histograms
- Lesson 3 - Pie charts
Drawing bar graphs and double bar graphs
The following is revision of what grade 7 learners have done in previous grades
Bar graph
A bar graph consists of vertical and horizontal bars. The bars are separate and do not touch each other. The length or the height of the bar represents a value of the set of data and all the bars are the same width. When drawing a bar graph, a suitable scale must be chosen to represent the data.
Example:
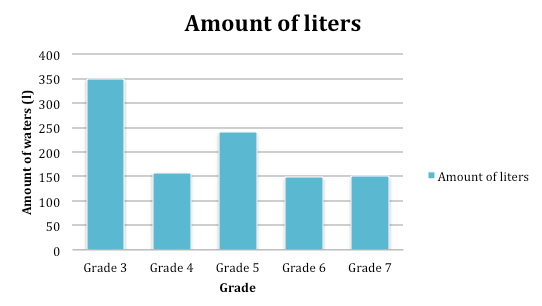
Our school held a competition amongst the grade 3 to grade 7 learners to see which grade could collect the most amount of water to send to towns which are affected by a drought. The competition was over a period of 3 weeks
The results are shown below:
The grade 7 learners had to draw the bar graph to show the results of the competition
Double bar graph
A double bar graph is similar to a bar graph, but on a double bar graph it shows two sets of bars. This is a useful way to compare two sets of data on one graph.
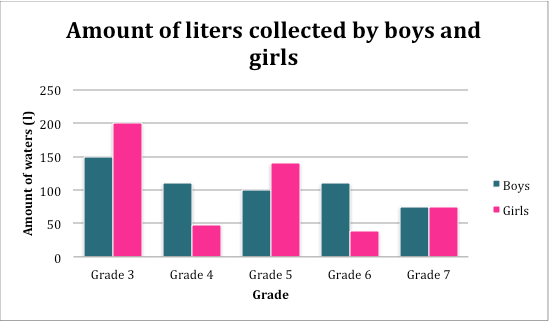
The data shown is the same as the previous example, only this time we can also see the data has been broken down into the amount of liters collected by boys and girls.
The results are shown below:
The grade 7 learners had to draw a double bar graph to show the new data


Good content to apply in high school, we can use to properly graph what is necessary, can be applied even in the notes of the students.
Excellent explanation of bar graphs and double bar, simple but clear, thanks for sharing.
Thank you for the comment. Yes, educators must try to explain the work on the learners level and revision of the work is also very important.
Hello friend, I hope you do not mind that I mentioned you in my post Playing mathematically # 1 where they should make bar graphs.
You got a 1.48% upvote from @postpromoter courtesy of @apteacher!
Want to promote your posts too? Check out the Steem Bot Tracker website for more info. If you would like to support the development of @postpromoter and the bot tracker please vote for @yabapmatt for witness!