Data - Lesson 3
Pie Charts
A pie chart is a circle that is divided into slices. These slices are called sectors. The circle represents the whole data set and the sectors represents the different parts of the whole.
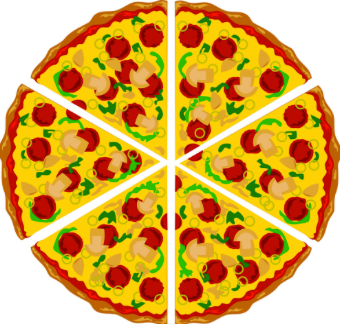
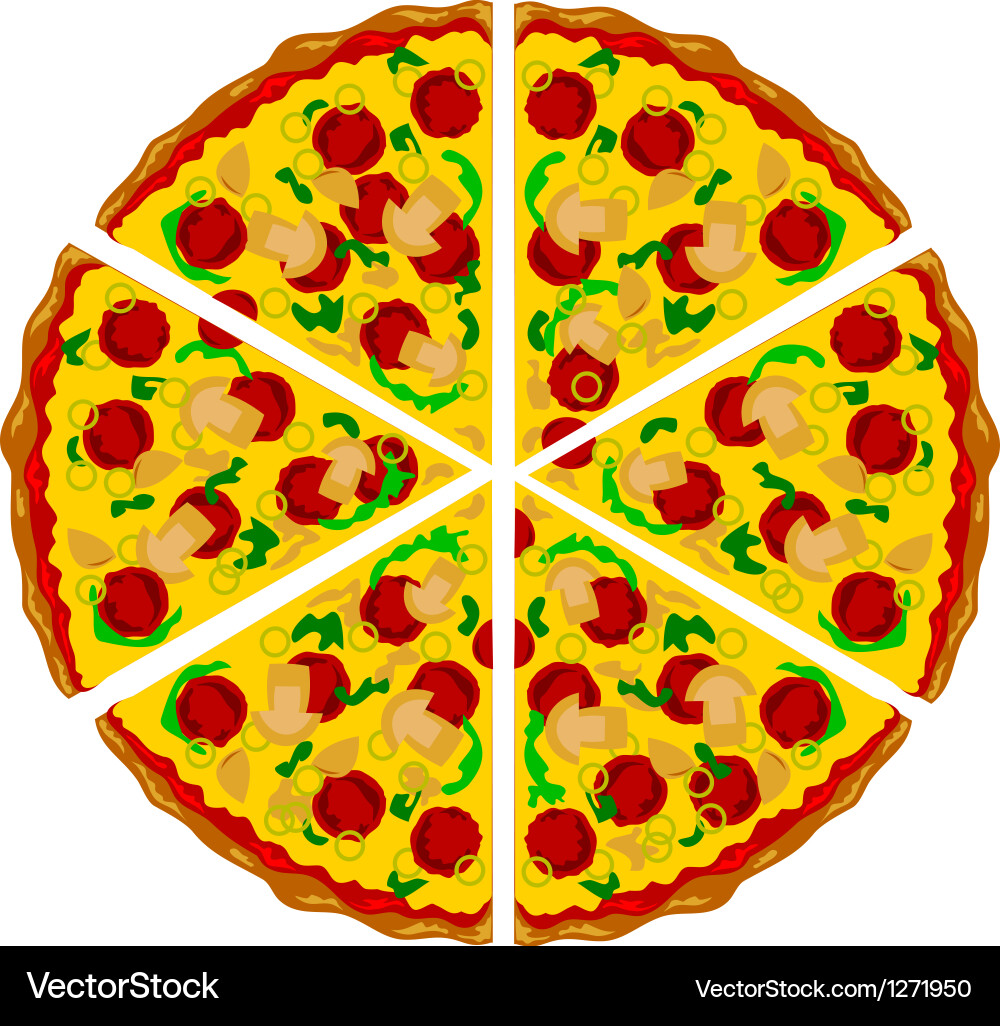
Think of a pizza, if you have 1 whole pizza, you eat the different slices. The pizza can be divided into different parts, for example, quarters, sixths or eighths etc.
We can use the following as an example:
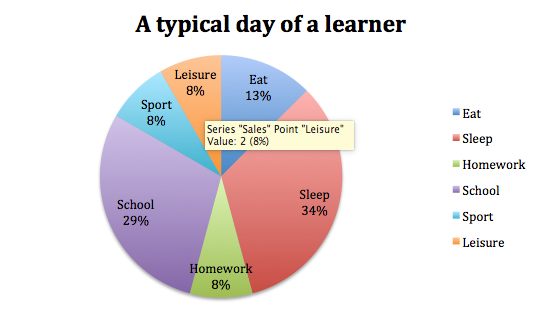
A typical day of a grade 7 learner:
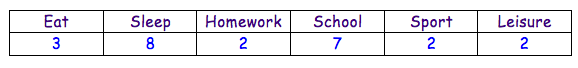
The table above shows the hours spent in a day. We can see that the learner takes 3 hours of the day for meals, 8 hours for sleep, 2 hours for his/her homework, 7 hours he/she spends at school, 2 hours for sport and leisure respectively.
If we add all the categories together, we will see that it adds up to 24, which means a day consists of 24 hours.
To draw the pie chart of the information above, we can do the following:
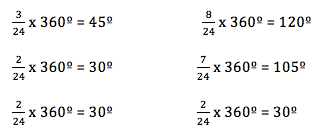
Because there are 24 hours in total, we divide each category by 24 and multiply it with 360º to get the angle of the slice (sector) of the circle.
- Eat: 3 ÷ 24 x 360º
- Sleep: 8 ÷ 24 x 360º
- Homework: 2 ÷ 24 x 360º
- School: 7 ÷ 24 x 360º
- Sport: 2 ÷ 24 x 360º
- Leisure: 2 ÷ 24 x 360º
After we've calculated the size of each angle we can draw the pie chart.
To draw a pie chart we have to remember the following:
- Use a pair of compasses to draw a neat circle.
- Calculate the angle of each sector of the circle as a fraction of 360º
- Divide the circle into sectors of the sizes that you calculated. Use a protractor to do this.
- Remember to give your pie chart a heading and write a description on the inside or on the outside of each sector
To calculate the percentage of each sector, you divide the category by the total and multiply it by 100 to get percentage.
OR
To calculate the percentage of each sector, we can take the angle size calculated and divide it by 360º and multiply the answer with 100.
Both of these calculations can be used to calculate the percentage of each sector.
If we take the hours spent on homework, we say: 2 ÷ 24 x 100 = 8,3333333 rounded off to the nearest whole, it will be 8%.
If we take the angle size of homework, we say: 30 ÷ 360 x 100 = 8,3333333 rounded off to the nearest whole, it will also be 8%.
If we add all the percentages together it must always be equal to 100% because percentage is out of 100
If we add all the angle sizes together it must always be equal to 360º because a circle is exactly 360º

You got a 3.63% upvote from @postpromoter courtesy of @apteacher!
Want to promote your posts too? Check out the Steem Bot Tracker website for more info. If you would like to support the development of @postpromoter and the bot tracker please vote for @yabapmatt for witness!
Nice flowing style tutorial, understanding how to get there is always interesting to learn @apteacher
#teamsouthafrica
https://discord.gg/9KVccPH Come Connect